Fig. 9
Download original image
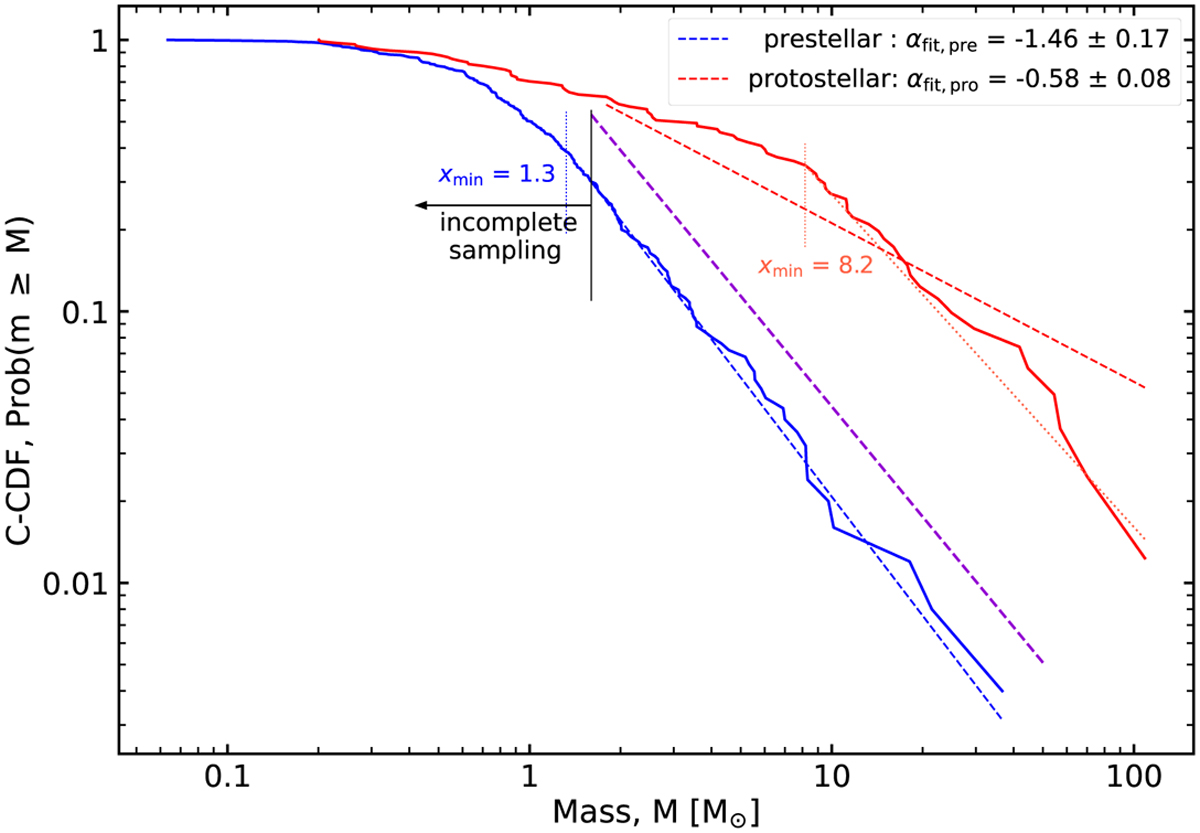
CMFs for the prestellar (in blue) and protostellar (in red) cores in W43. CMFs are represented in the form of a complementary cumulative distribution function (C-CDF) fitted with the MLE method implemented in the powerlaw package (Alstott et al. 2014). Dashed lines represent the fit made above the 1.6 M⊙ completeness limit (black vertical line) with single power laws whose slopes are indicated. xmin values are indicated and the fit above xmin is shown in dotted line for the protostellar CMF (slope of αfit,pro,2 = −1.22 ± 0.23). The canonical Salpeter slope of the IMF (−1.35 on this form) is represented with a dashed purple line.
Current usage metrics show cumulative count of Article Views (full-text article views including HTML views, PDF and ePub downloads, according to the available data) and Abstracts Views on Vision4Press platform.
Data correspond to usage on the plateform after 2015. The current usage metrics is available 48-96 hours after online publication and is updated daily on week days.
Initial download of the metrics may take a while.