Open Access
Fig. 7
Download original image
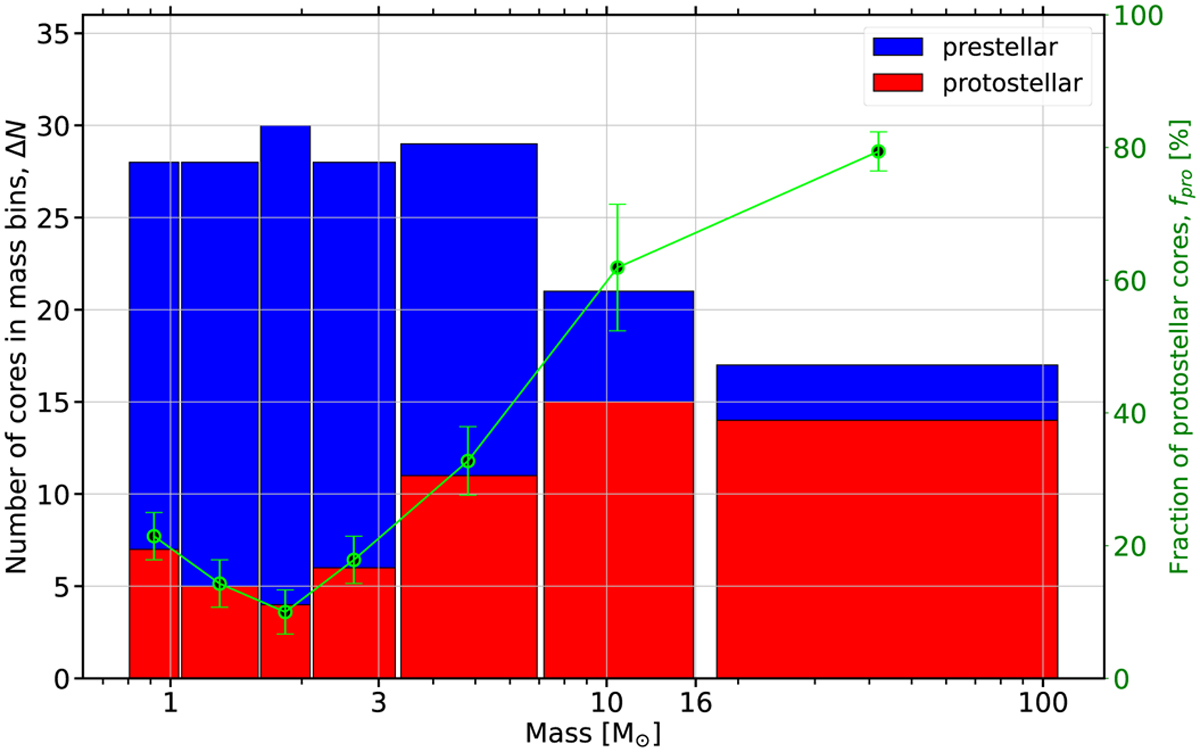
Mass histogram of prestellar and protostellar cores in W43. Cores are divided into seven mass bins, from 0.8 to 110 M⊙. Green circles indicate, in each bin, the percentage of protostellar cores among all, protostellar and prestellar, cores (see right axis).
Current usage metrics show cumulative count of Article Views (full-text article views including HTML views, PDF and ePub downloads, according to the available data) and Abstracts Views on Vision4Press platform.
Data correspond to usage on the plateform after 2015. The current usage metrics is available 48-96 hours after online publication and is updated daily on week days.
Initial download of the metrics may take a while.