Fig. 6
Download original image
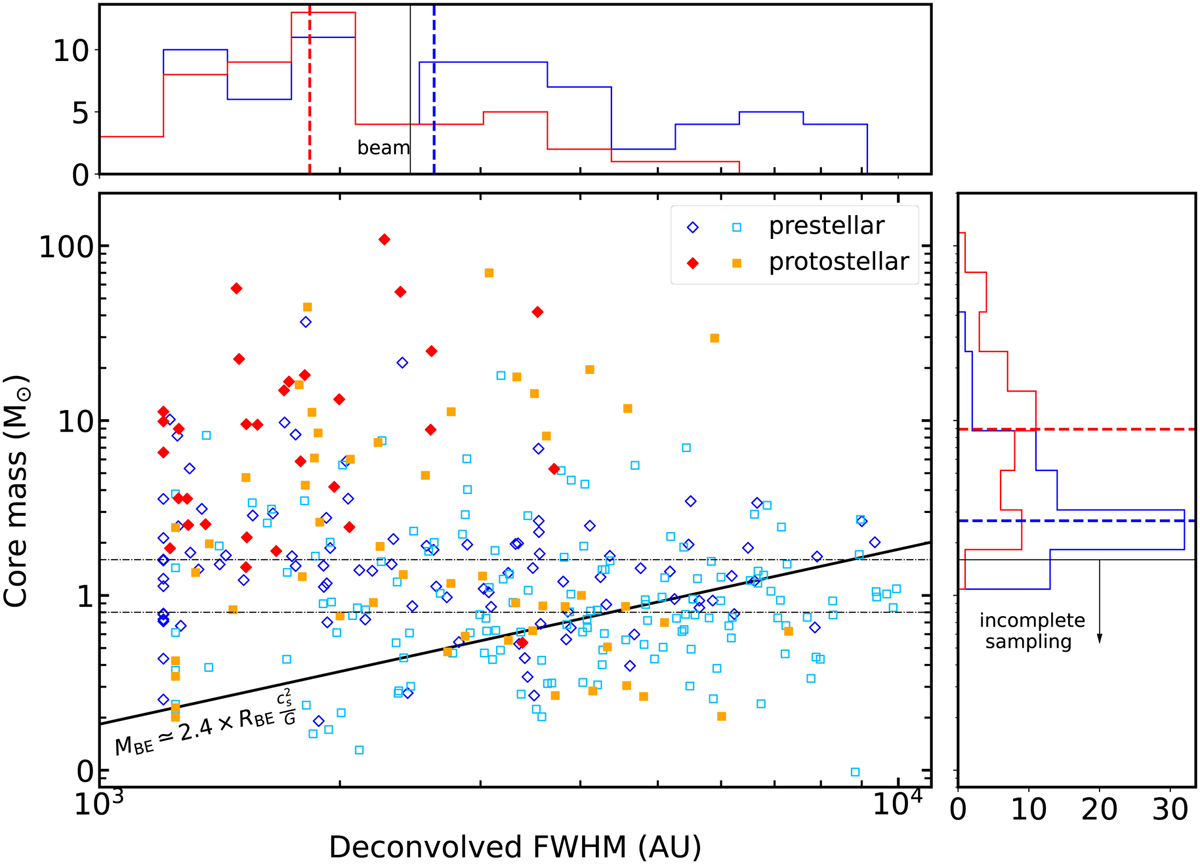
Mass vs. size diagram for cores in W43, compared to the mass-size relation of critical Bonnor-Ebert spheres at Tdust = 23 Κ (black solid line). The core FWHMs are deconvolved from the beams, where the minimum deconvolved size corresponds to a half-beam angular diameter. In the main panel, the core sample is divided between prestellar core (represented by empty, blue and cyan symbols) and protostellar cores (filled, red and orange symbols), as well as between cores lying in W43-MM1 (diamonds) and in W43-MM2&MM3 (squares). Completeness levels in W43-MM1 and W43-MM2&MM3, 1.6 M⊙ and 0.8 M⊙ respectively, are represented by horizontal dashed lines. In the lateral panels are represented the marginal distributions of masses and FWHM sizes for the combined W43 region (W43-MM1 + W43-MM2&MM3), excluding cores below the common 1.6 M⊙ completeness limit. Distributions of prestellar and protostellar core parameters are displayed in blue and red, respectively. The dashed lines show their median values.
Current usage metrics show cumulative count of Article Views (full-text article views including HTML views, PDF and ePub downloads, according to the available data) and Abstracts Views on Vision4Press platform.
Data correspond to usage on the plateform after 2015. The current usage metrics is available 48-96 hours after online publication and is updated daily on week days.
Initial download of the metrics may take a while.