Fig. 5
Download original image
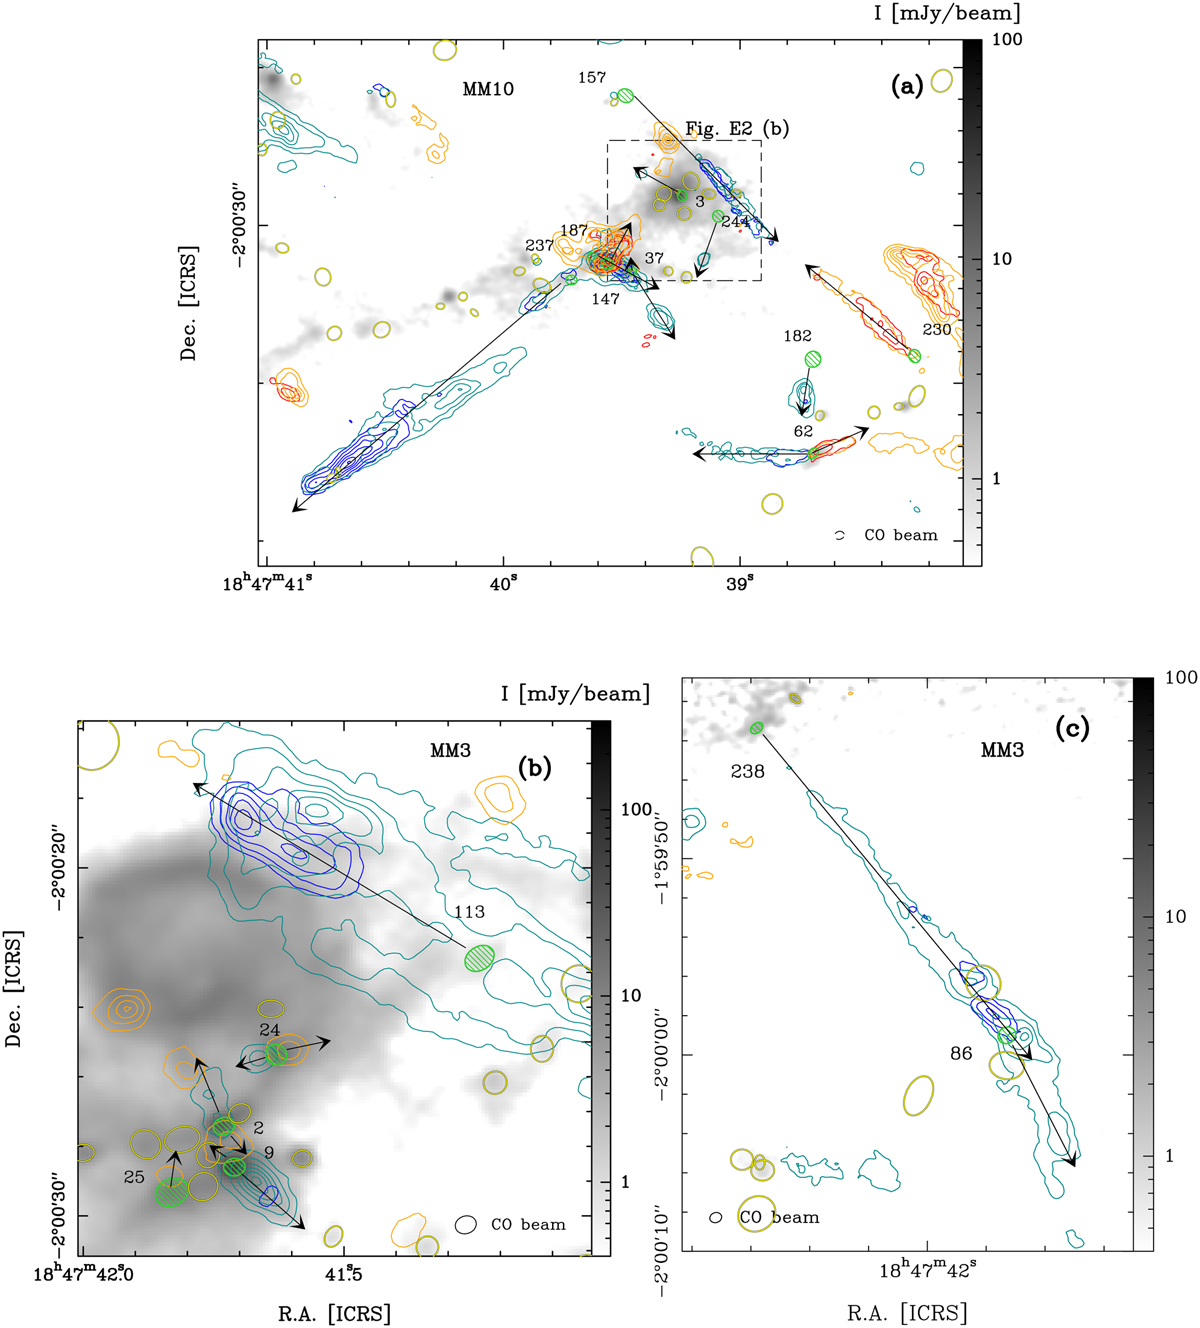
Zoom from Fig. 2 towards W43-MM3, with the same colour code as in Fig. 4 except for the high-velocity integration of CO (in red contours) which is 125.9–133.6 km s−1 instead of 119.6–127.2 km s−1. Contours are 4, 10 to Max by steps of 10 in units of σHV3 = 13 mJy beam−1 km s−1 at high velocity and 5, 15 to Max by steps of 15 in units of σLV3 = 5 mJy beam−1 km s−1 at low velocity. Same convention as in Fig. 4 for lines and ellipses. An additional zoomed-in figure highlighting outflows from cores #3 and #244 is provided in Fig. E.2b.
Current usage metrics show cumulative count of Article Views (full-text article views including HTML views, PDF and ePub downloads, according to the available data) and Abstracts Views on Vision4Press platform.
Data correspond to usage on the plateform after 2015. The current usage metrics is available 48-96 hours after online publication and is updated daily on week days.
Initial download of the metrics may take a while.