Fig. 3
Download original image
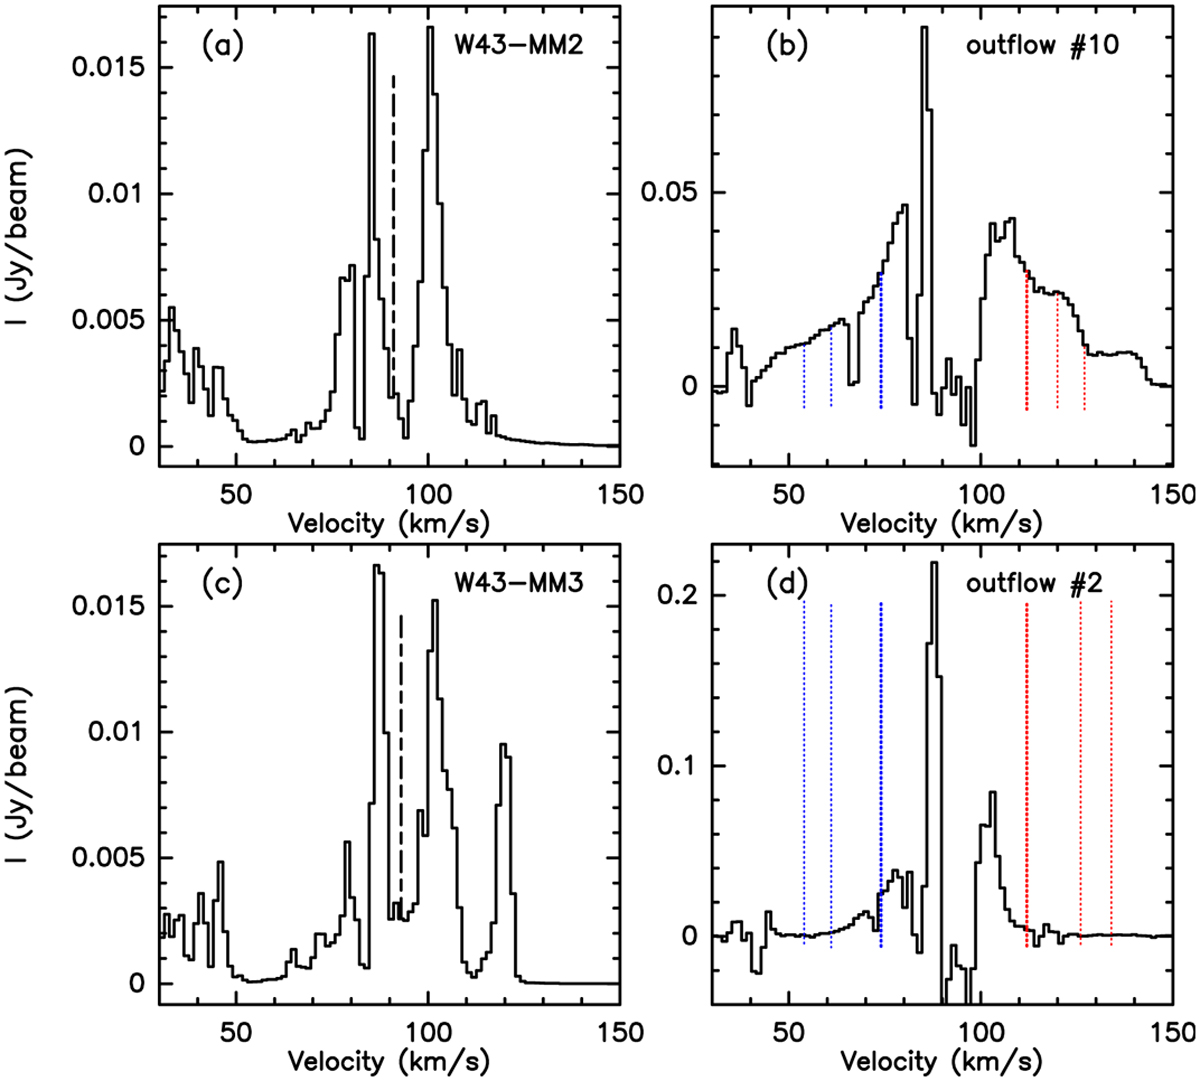
Spectra of the CO (2−1) line towards the entire W43-MM2 and W43-MM3 regions (a and c) and towards bright outflows (b and d). The systemic velocities, VLSR = 91 km s−1 and VLSR = 93 km s−1 for W43-MM2 and W43-MM3, respectively, are measured with the DCN(3-2) line (Cunningham et al. 2023) and are indicated by black dashed lines in (a) and (c). The limits of the high- and low-velocity intervals are indicated by blue and red dotted lines in (b) and (d).
Current usage metrics show cumulative count of Article Views (full-text article views including HTML views, PDF and ePub downloads, according to the available data) and Abstracts Views on Vision4Press platform.
Data correspond to usage on the plateform after 2015. The current usage metrics is available 48-96 hours after online publication and is updated daily on week days.
Initial download of the metrics may take a while.