Fig. 2

Download original image
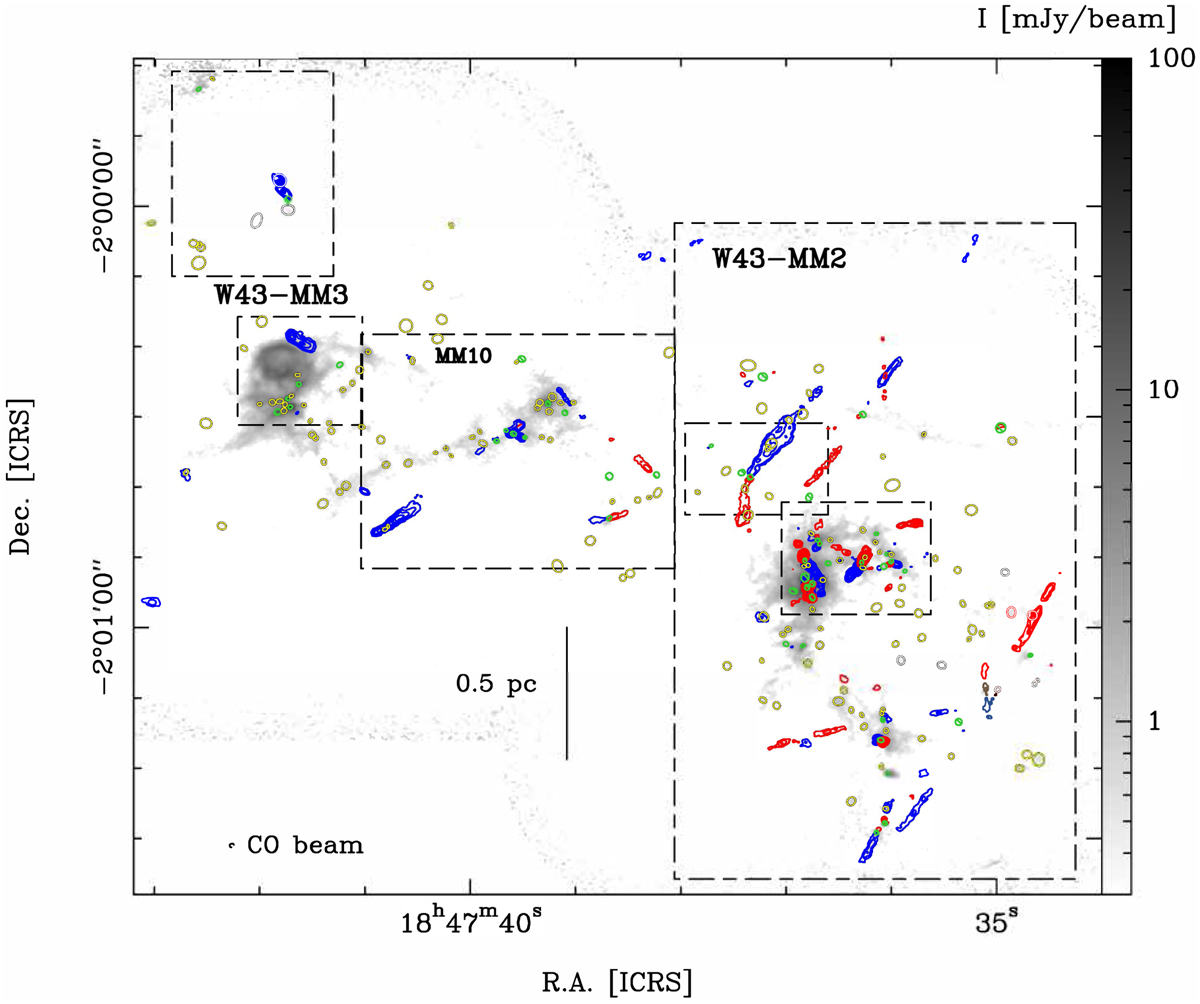
Molecular outflows in the W43-MM2&MM3 region overlaid on the 1.3-mm continuum emission (grey scale). The CO (2−1) blue- and red-shifted line wings, integrated over 53.6–61.2 km s−1 and 125.9–133.6 km s−1 respectively, are overlaid as blue and red contours on the 1.3 mm bsens* continuum image. Contours are 5, 10 to Max by steps of 10 in units of σ, with σ = 10 mJy beam−1 km s−1 and 13 mJy beam−1 km s−1 in MM2 and MM3, respectively. Cores driving outflows are represented by green ellipses showing their FWHM size, while other cores are represented by yellow ellipses. The beam of the CO cubes is represented in the lower left corner and a scale bar is shown. The position of the zooms shown in Figs. 4 and 5 are delimited with dashed lines.
Current usage metrics show cumulative count of Article Views (full-text article views including HTML views, PDF and ePub downloads, according to the available data) and Abstracts Views on Vision4Press platform.
Data correspond to usage on the plateform after 2015. The current usage metrics is available 48-96 hours after online publication and is updated daily on week days.
Initial download of the metrics may take a while.


