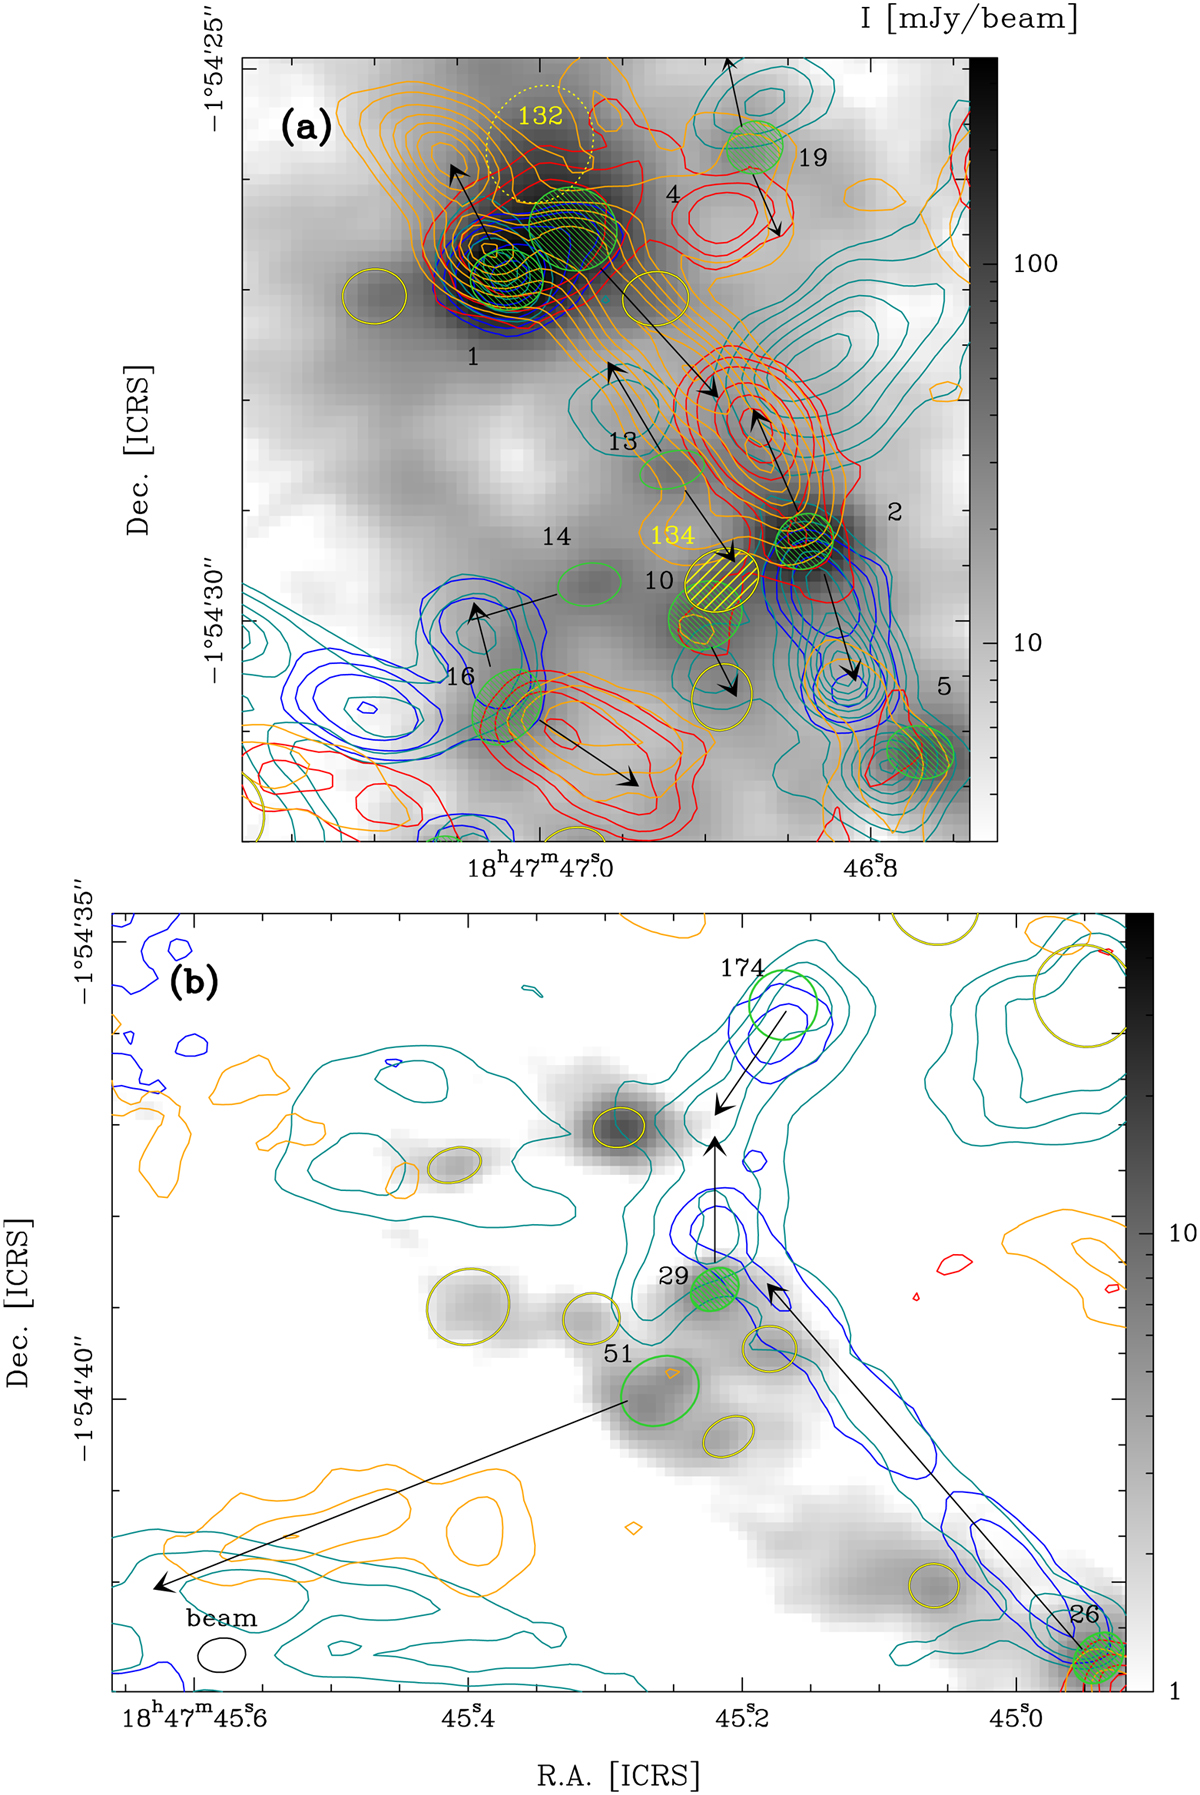
Fig. E.3
Download original image
Zooms in towards areas of W43-MM1 with new cores and outflow detection. The CO (2−1) blue-shifted line wing is integrated over 42 – 64 km s−1 (HV, blue contours) and 82 – 88 km s−1 (LV, cyan contours), the red-shifted line wing over 108 – 119 km s−1 (LV, orange contours) and 128 – 158 km s−1 (HV, red contours). In a: For blue lobes, contours are 7, 15, 30 to 230 by steps of 40 (HV) and 7, 15 to 120 by steps of 15 (LV), in units of σ = 20 mJy beam−1 km s−1. For red lobes, contours are 10, 20 to 160 by steps of 20, in units of σLV,R = 37 mJy beam−1 km s−1 (LV) and 7, 15, 30 to 280 by steps of 50, in units of σ (HV). In b: For blue lobes, contours are 5, 15, 30 by steps of 15 (HV) and 10, 20, 30 (LV), in units of σ = 20 mJy beam−1 km s−1. For red lobes, contours are 5, 15, 25, 35, in units of σLV,R = 37 mJy beam−1 km s−1 (LV) and 5, 15 to 75 by steps of 15, in units of σ (HV). In a and b: Green ellipses locate protostellar cores, arrows indicate the direction of their outflows. Prestellar core candidates are represented with yellow ellipses, hatched for the high-mass core #134 in (a). The source #132 discarded from the core sample is shown with a dotted yellow ellipse. Adapted from Figs. 3 and 4 of Nony et al. (2020).
Current usage metrics show cumulative count of Article Views (full-text article views including HTML views, PDF and ePub downloads, according to the available data) and Abstracts Views on Vision4Press platform.
Data correspond to usage on the plateform after 2015. The current usage metrics is available 48-96 hours after online publication and is updated daily on week days.
Initial download of the metrics may take a while.