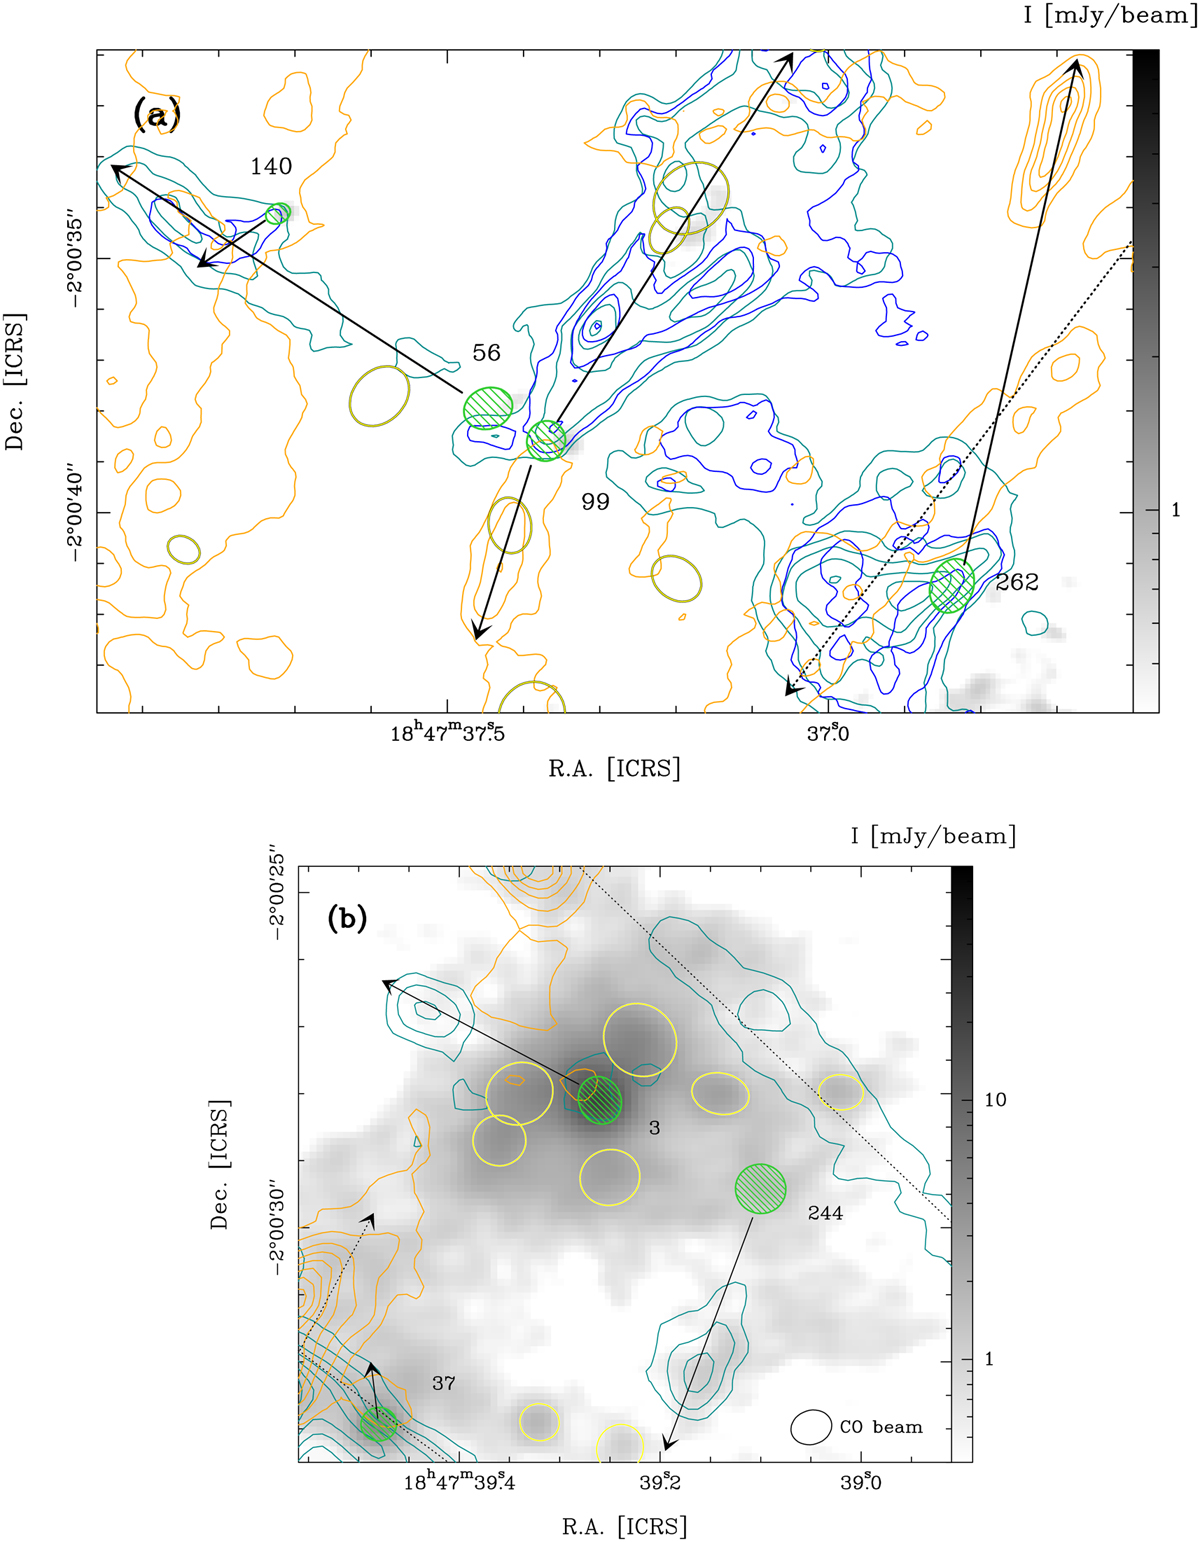
Fig. E.2
Download original image
Zooms from Fig. 4 towards the north of W43-MM2 (in a) and from Fig. 5 toward the south of W43-MM3 (MM10) (in b). In a: The CO (2−1) blue-shifted line wing is integrated over 73.9-75.1 km s−1 (blue contours) and 75.1-80.2 km s−1 (cyan contours). The red-shifted line wing is integrated over 108.2-109.4 km s−1 (orange contours). Contours are 4 to Max by steps of 10 in units of σ = 4 mJy beam−1 km s−1 (blue and orange) and 10 mJy beam−1 km s−1 (cyan). In b: The CO (2−1) blue-shifted line wing is integrated over 73.9-80.2 km s−1 (cyan contours), the red-shifted line wing over 110.7-112.0 km s−1 (orange contours). Contours are 4, 10 to Max by steps of 10 in units of σ = 13 and 5 mJy beam−1 km s−1, respectively. In a-b: Cores driving outflows are represented by green ellipses showing their FWHM size and numbered. Arrows indicate the direction of their outflows, an ellipse representing the angular resolution of CO cube is shown in the lower right. Prestellar core candidates are represented by yellow ellipses.
Current usage metrics show cumulative count of Article Views (full-text article views including HTML views, PDF and ePub downloads, according to the available data) and Abstracts Views on Vision4Press platform.
Data correspond to usage on the plateform after 2015. The current usage metrics is available 48-96 hours after online publication and is updated daily on week days.
Initial download of the metrics may take a while.