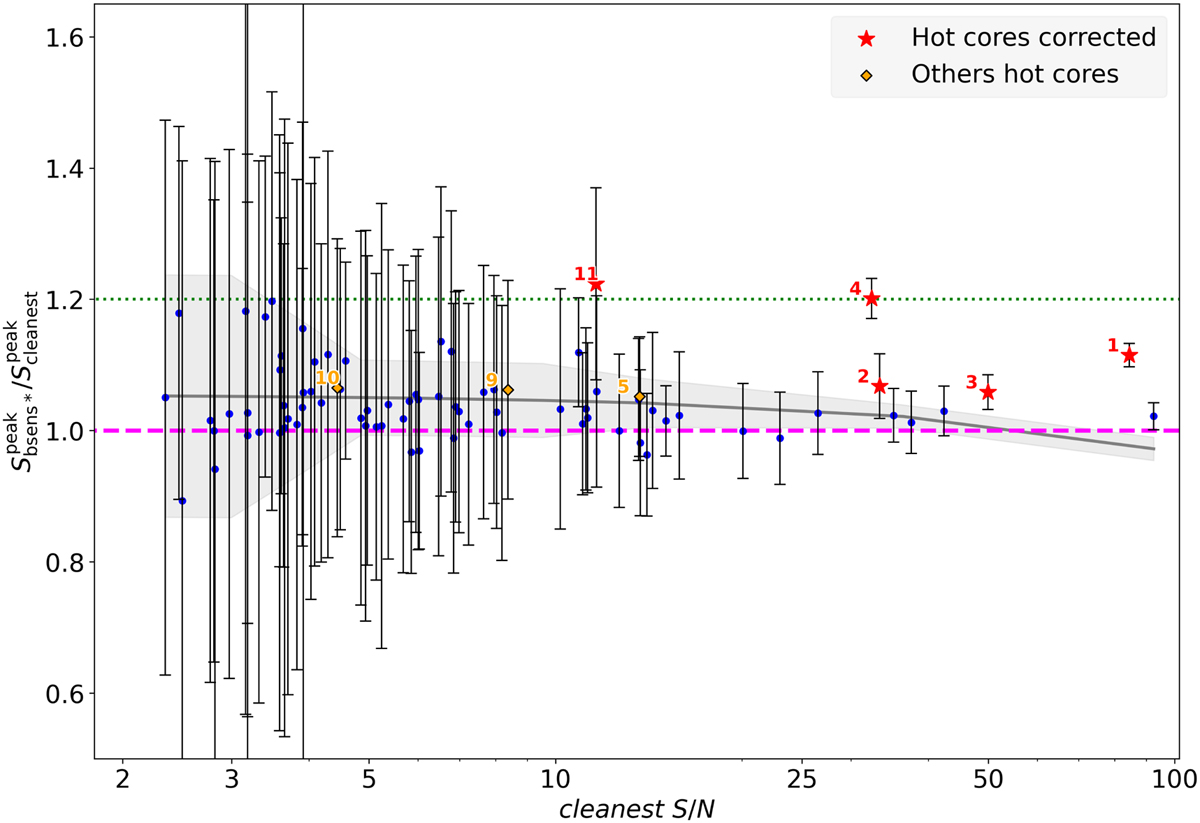
Fig. E.1
Download original image
Line contamination of the 1.3 mm continuum fluxes of cores detected in W43-MM1, as estimated from the ratio of their bsens* over cleanest peak fluxes and shown as a function of the S/N in the cleanest image. The grey curve indicates the median value of the core ratios, computed over bins of 20 adjacent cores as ranked by their S/N. The shaded grey area indicates the corresponding 3σ dispersion in flux ratio values. Red and orange points locate cores identified as hot cores by Brouillet et al. (2022). cleanest fluxes have been used instead of bsens* for the five cores with significant contamination levels, shown in red. The horizontal lines indicate the contamination levels of 0% (magenta dashed line) and 20% (green dotted line).
Current usage metrics show cumulative count of Article Views (full-text article views including HTML views, PDF and ePub downloads, according to the available data) and Abstracts Views on Vision4Press platform.
Data correspond to usage on the plateform after 2015. The current usage metrics is available 48-96 hours after online publication and is updated daily on week days.
Initial download of the metrics may take a while.