Fig. C.1
Download original image
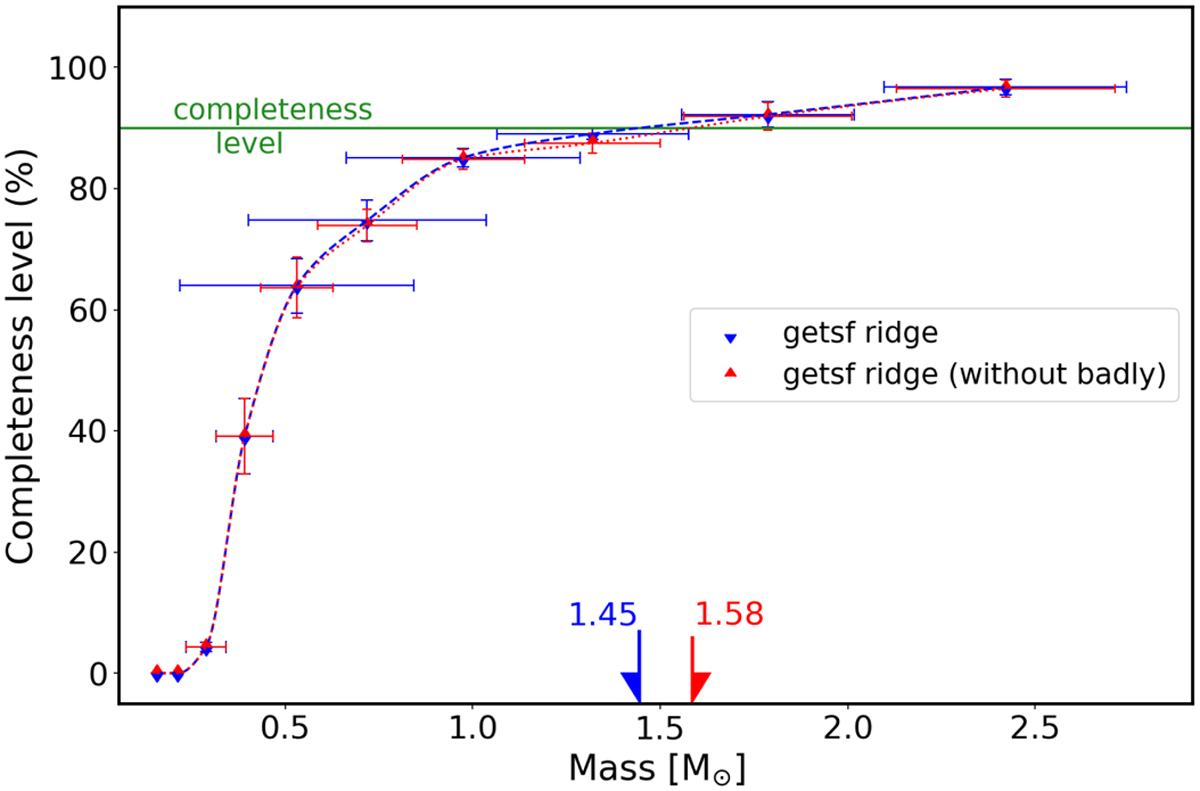
Completeness levels of the ~3200 synthetic sources added on the centre of the background image of W43-MM1. The core catalogue is 90% complete down to 1.6 ± 0.2 M⊙. Error bars represent the ±1σ uncertainties, measured from the dispersion of mass measurements across each bin (x-axis) and from the dispersion of detection rates between the four set of simulations (y-axis). Blue points represent the full sample of sources detected by getsf, red points only measure the bin completeness for cores that have mass measurements within a factor of two of the reference.
Current usage metrics show cumulative count of Article Views (full-text article views including HTML views, PDF and ePub downloads, according to the available data) and Abstracts Views on Vision4Press platform.
Data correspond to usage on the plateform after 2015. The current usage metrics is available 48-96 hours after online publication and is updated daily on week days.
Initial download of the metrics may take a while.