Fig. B.1
Download original image
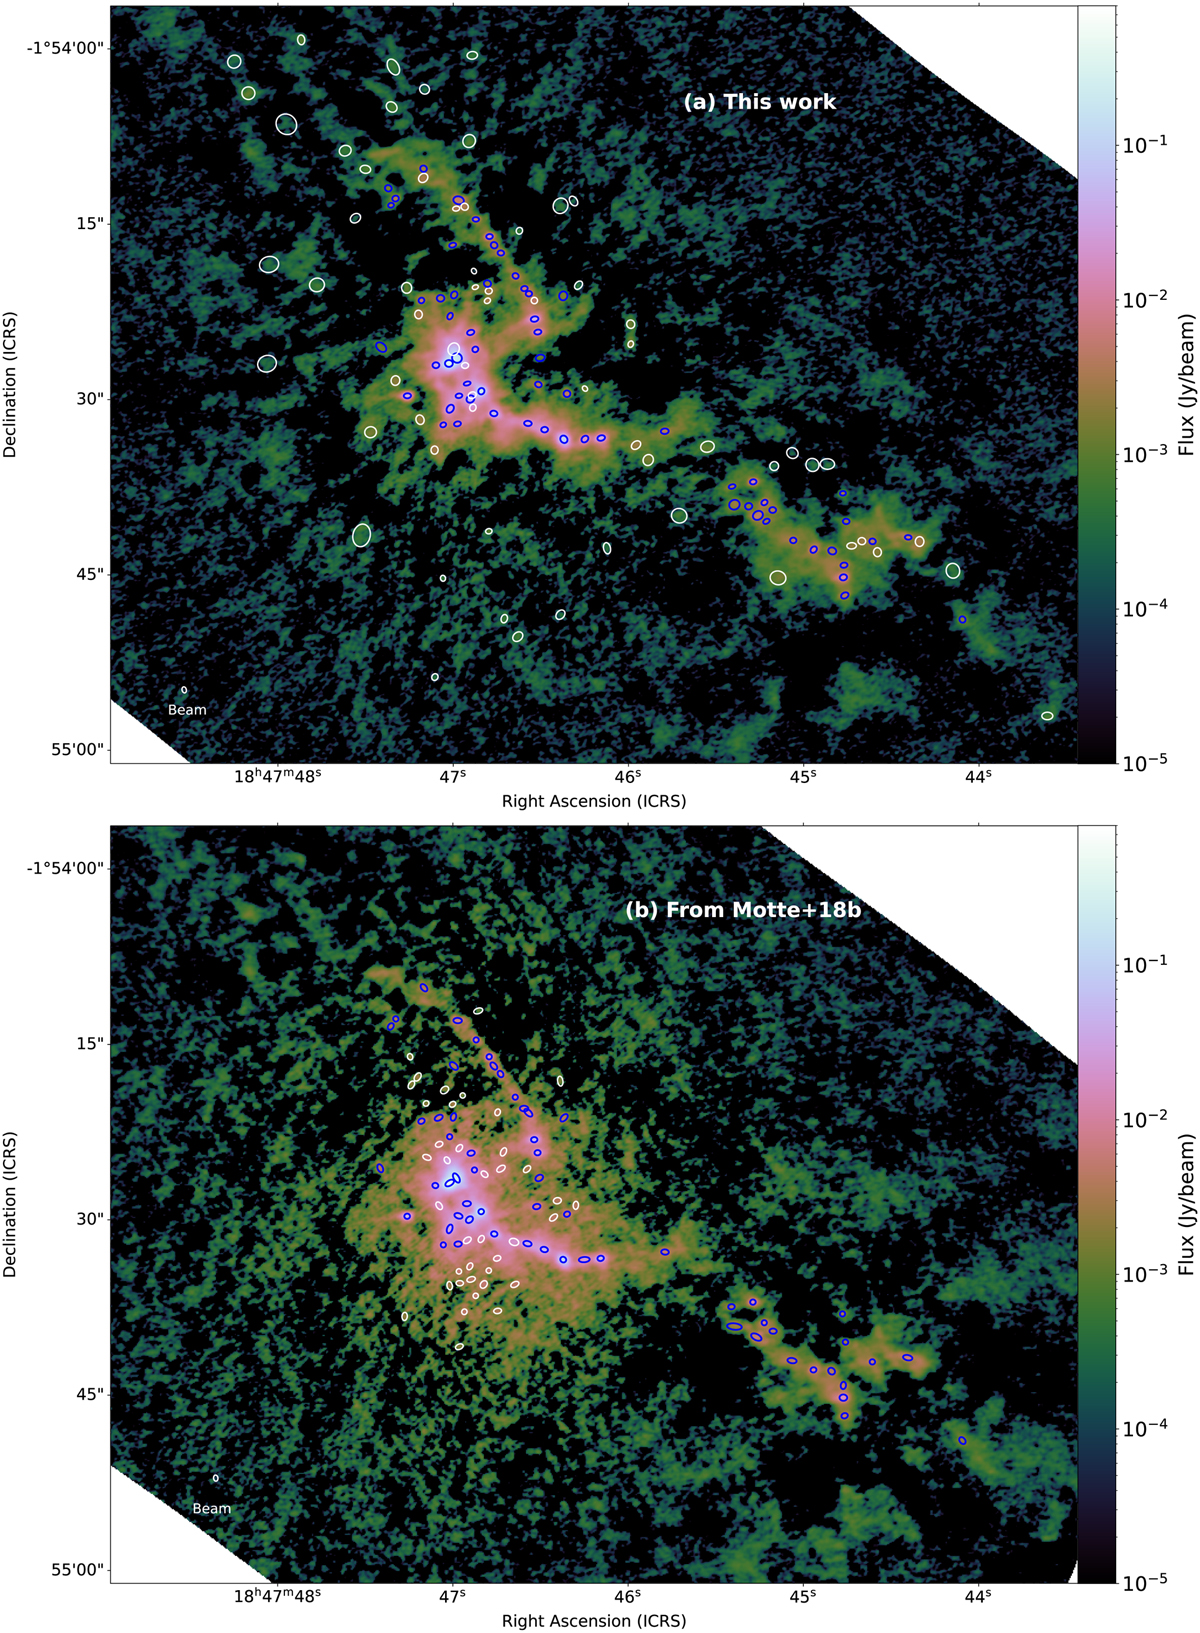
Continuum image of W43-MM1 obtained using the ALMA-IMF pipeline (top) compared with that shown in Motte et al. (2018b) (bottom). Cores common to the two catalogues are represented as blue ellipses, cores unique in each catalogue as white ellipses. Images are drawn with the same logarithmic colour scale and have almost equal beam, shown in the bottom left corner. A reduction of the noise level around the central part is visible in the top image, which should be attributed to the improvement in our data reduction methods.
Current usage metrics show cumulative count of Article Views (full-text article views including HTML views, PDF and ePub downloads, according to the available data) and Abstracts Views on Vision4Press platform.
Data correspond to usage on the plateform after 2015. The current usage metrics is available 48-96 hours after online publication and is updated daily on week days.
Initial download of the metrics may take a while.