Fig. 1
Download original image
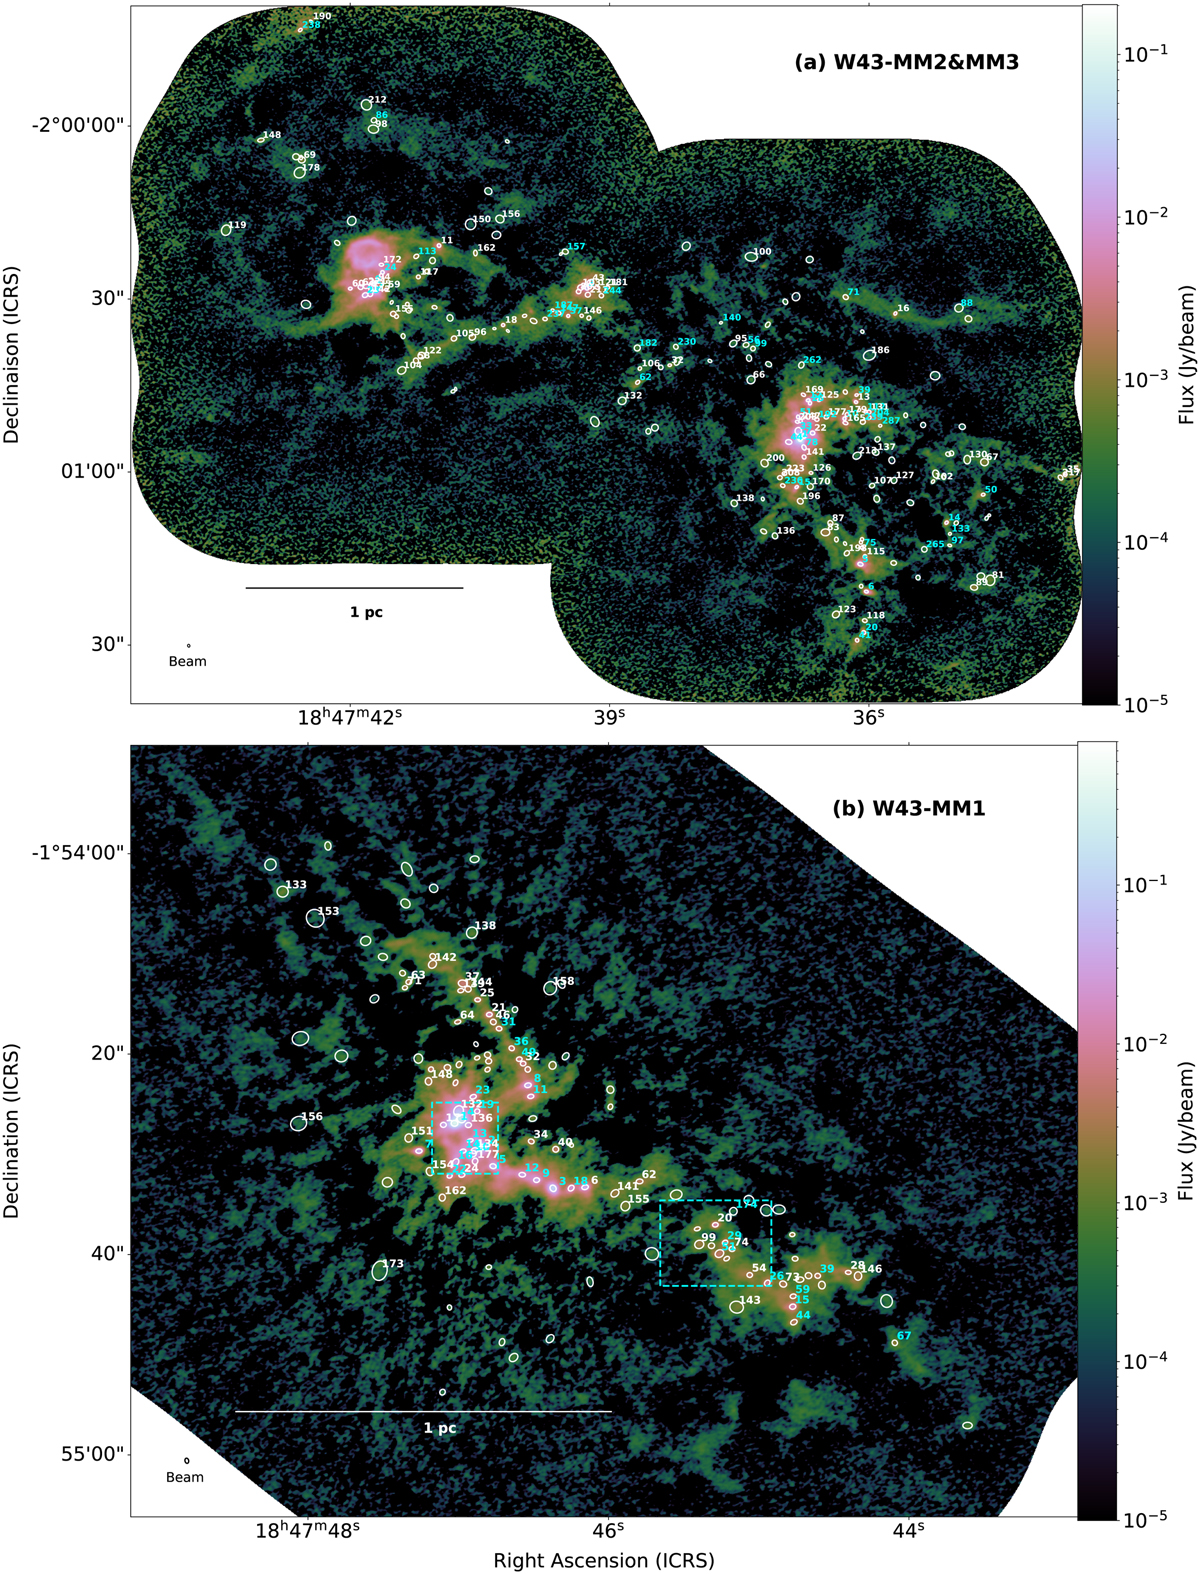
W43-MM2&MM3 (a) and W43-MM1 (b) protoclusters, as imaged at 1.3 mm by the ALMA 12-m array. The sources extracted with getsf are represented by ellipses showing their size at FWHM. Cores listed in Tables F.1 and F.2 are numbered in cyan for protostellar cores and in white for prestellar cores above the completeness limit (1.6 M⊙ and 0.8 M⊙ in a and b, resp.). bsens and bsens* continuum images are shown in (a) and (b), respectively. Rectangles in cyan in (b) indicate the position of the zooms provided in Fig. E.3 to highlight a new high-mass prestellar core candidate and new core-outflow associations. Ellipses in the lower left corners represent the angular resolution of the image and scale bars indicate the size in physical units.
Current usage metrics show cumulative count of Article Views (full-text article views including HTML views, PDF and ePub downloads, according to the available data) and Abstracts Views on Vision4Press platform.
Data correspond to usage on the plateform after 2015. The current usage metrics is available 48-96 hours after online publication and is updated daily on week days.
Initial download of the metrics may take a while.