Fig. 9
Download original image
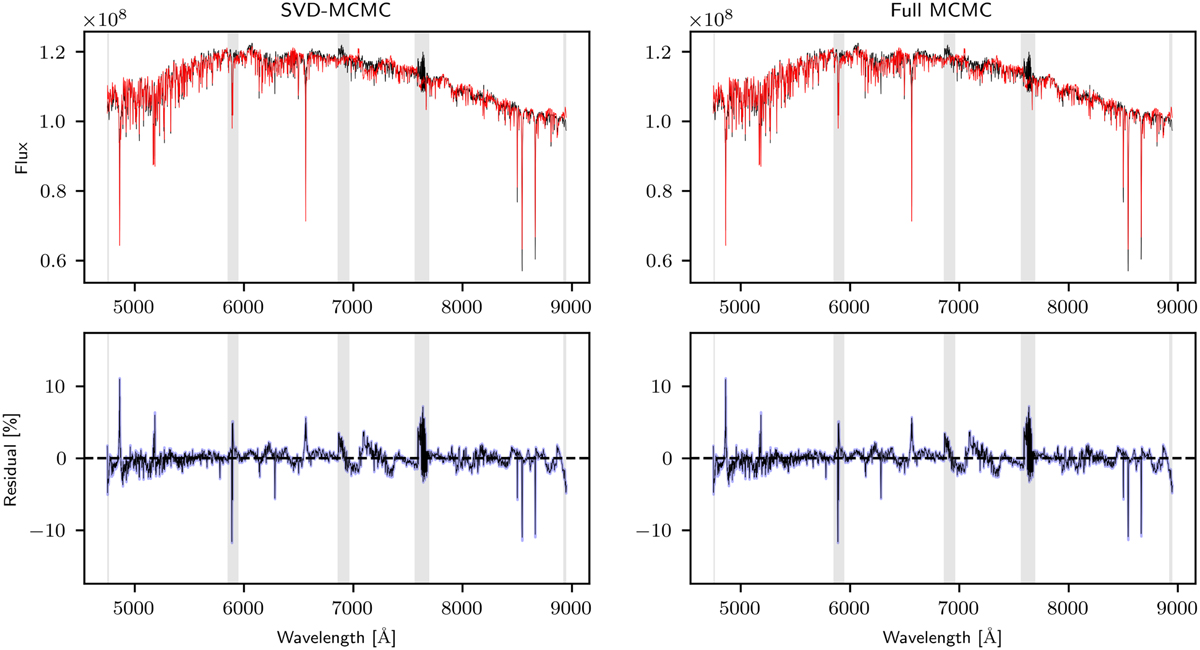
Integrated M 54 spectrum y and the data fit ypred (in red), both for SVD-MCMC (left) and Full MCMC (right). The data fit is related to the respective MCMC posterior mean fmean through ypred = Gfmean. The plots in the second row show the relative residuals ![]() , where y is the measurement data. The corresponding band (in blue) shows the simultaneous posterior predictive 95%-credible intervals. Grey vertical bands show wavelength regions which have been masked to avoid sky-residuals.
, where y is the measurement data. The corresponding band (in blue) shows the simultaneous posterior predictive 95%-credible intervals. Grey vertical bands show wavelength regions which have been masked to avoid sky-residuals.
Current usage metrics show cumulative count of Article Views (full-text article views including HTML views, PDF and ePub downloads, according to the available data) and Abstracts Views on Vision4Press platform.
Data correspond to usage on the plateform after 2015. The current usage metrics is available 48-96 hours after online publication and is updated daily on week days.
Initial download of the metrics may take a while.