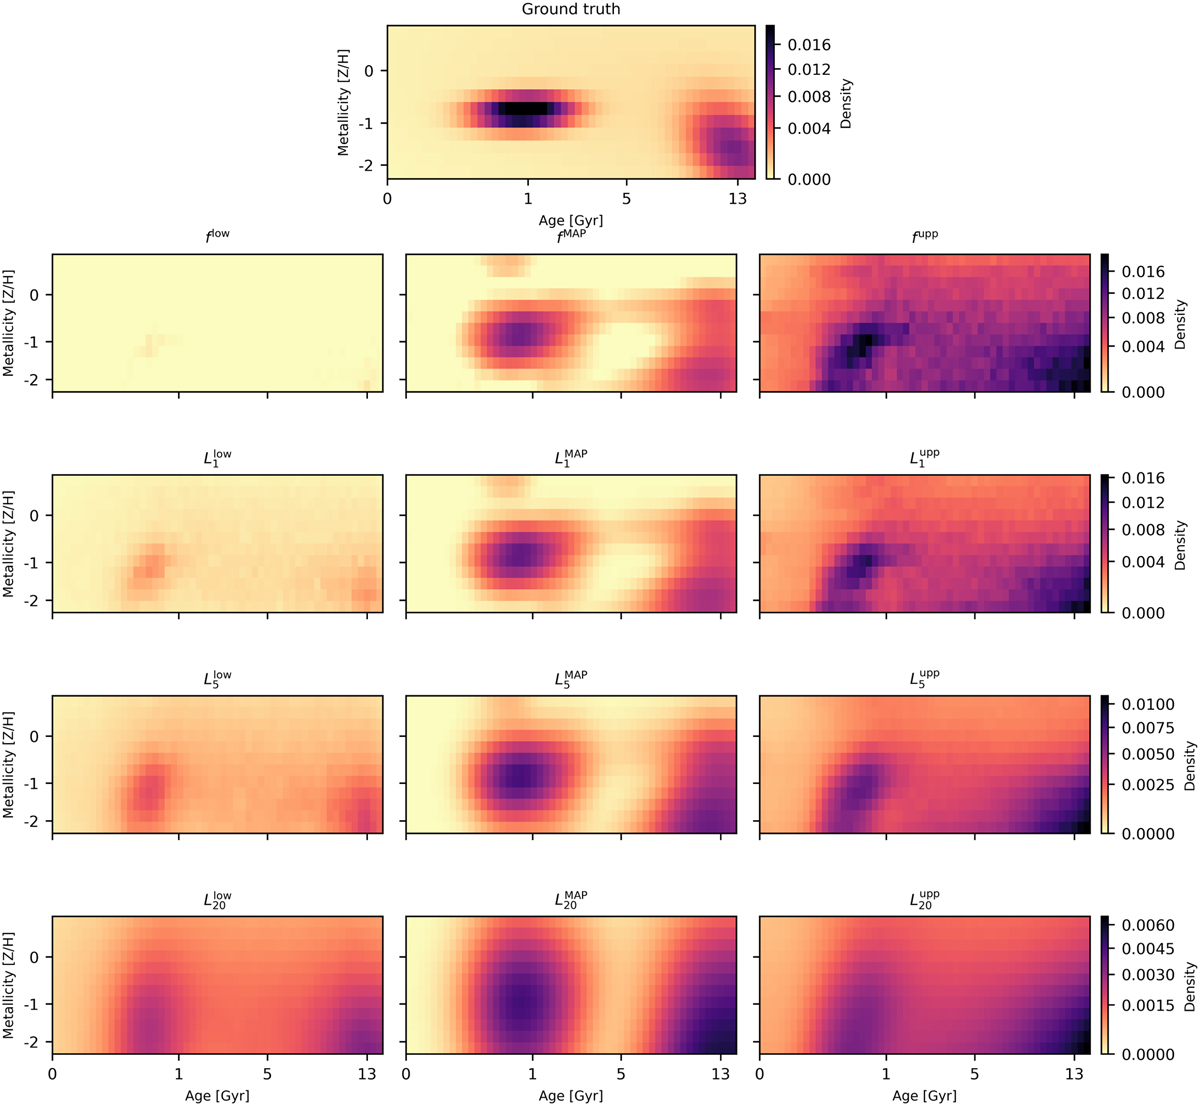
Fig. 5
Download original image
Visualisation of credible intervals from mock data. The upper panel shows the ground truth from which the mock data were generated. In the second row, the MAP estimate fMAP (centre column) together with the lower bound flow (left) and upper bound fupp (right) of the (unfiltered) simultaneous credible intervals are plotted. Below that are the lower and upper bound of filtered credible intervals at 3 different scales, together with the corresponding filtered MAP estimate ![]() .
.
Current usage metrics show cumulative count of Article Views (full-text article views including HTML views, PDF and ePub downloads, according to the available data) and Abstracts Views on Vision4Press platform.
Data correspond to usage on the plateform after 2015. The current usage metrics is available 48-96 hours after online publication and is updated daily on week days.
Initial download of the metrics may take a while.