Fig. B.1
Download original image
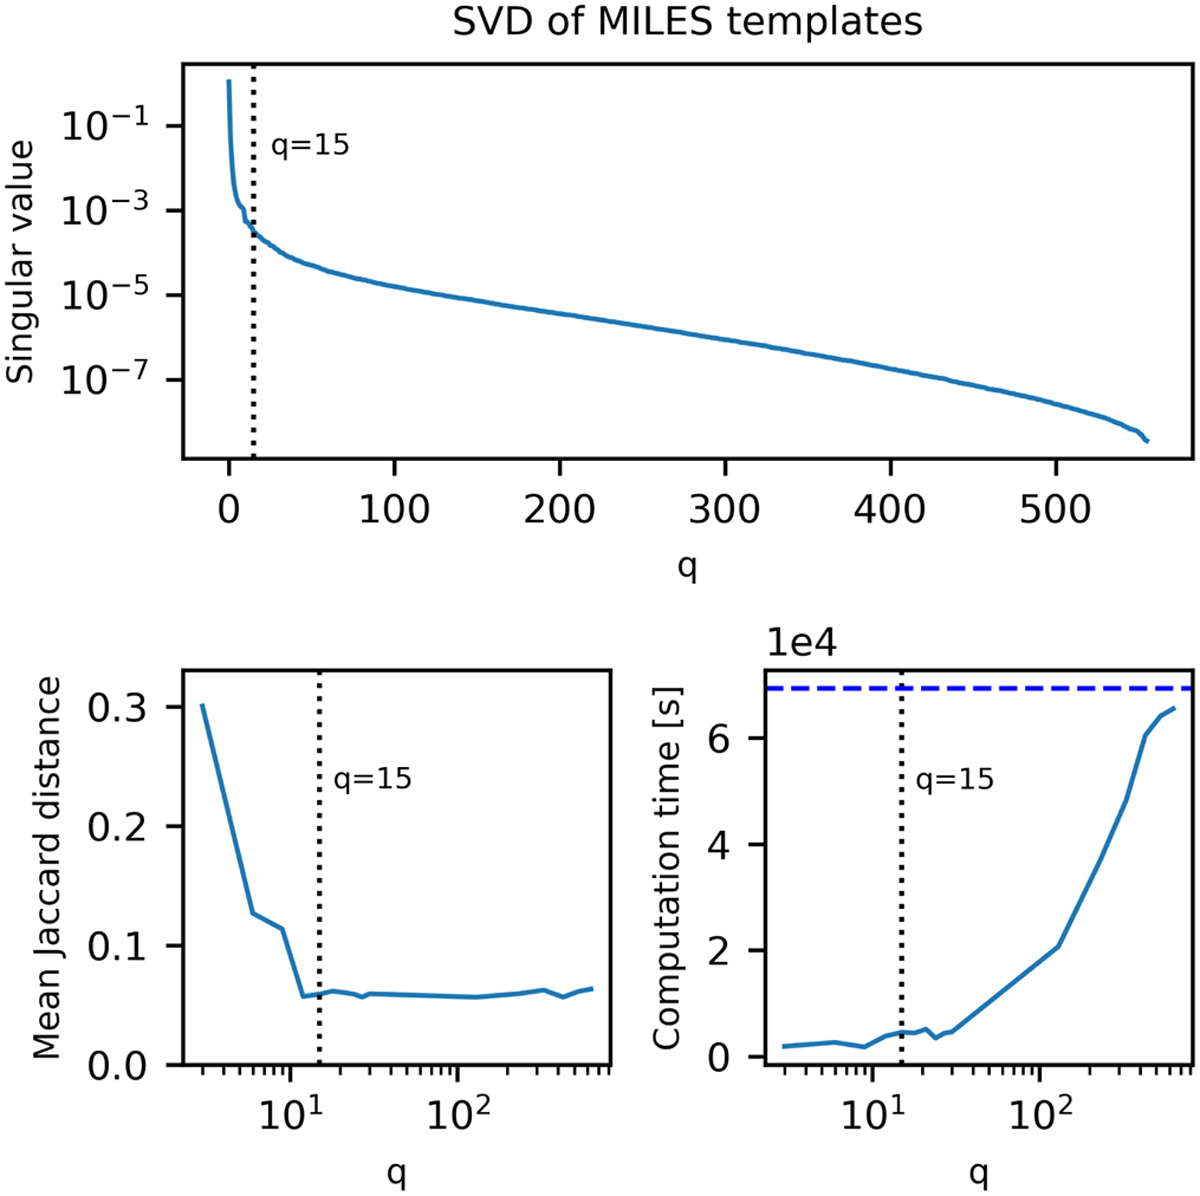
Influence of the latent dimension q on SVD-MCMC. The top panel shows singular values of the matrix of MILES SSPs. The lower left panel shows the error between filtered credible intervals computed with SVD-MCMC and Full MCMC. The error is measured in the mean Jaccard distance (see equation (B.1)). Beyond q = 15 the error stabilises, signalling converged results. The lower right panel shows the corresponding computation time for SVD-MCMC, where the dashed horizontal line marks the computation time for Full MCMC. In all panels, the vertical dotted line is at q = 15, the value adopted for SVD-MCMC inferences in this work.
Current usage metrics show cumulative count of Article Views (full-text article views including HTML views, PDF and ePub downloads, according to the available data) and Abstracts Views on Vision4Press platform.
Data correspond to usage on the plateform after 2015. The current usage metrics is available 48-96 hours after online publication and is updated daily on week days.
Initial download of the metrics may take a while.