Fig. 6
Download original image
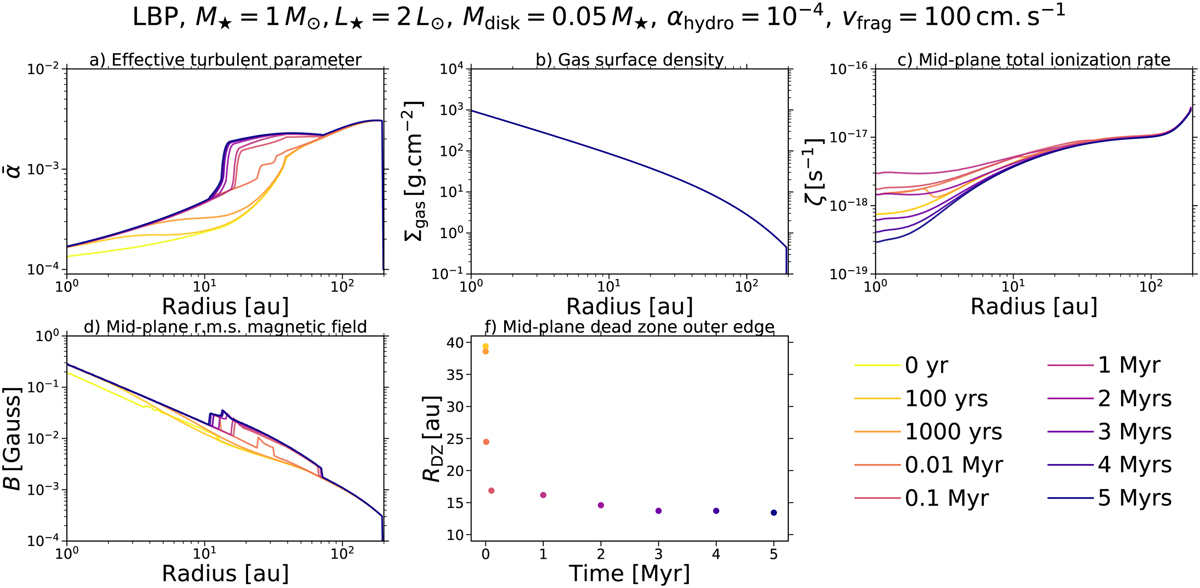
Same as in Fig. 4, except for Model V. The corresponding temporal evolution of the five dust quantities is shown in Fig. 7. The gas surface density (panel b) is fixed to the input profile corresponding to the classical self-similar solution (Lynden-Bell & Pringle 1974), with a total disk gas mass Mdisk = 0.05 M⋆, and a critical radius Rc = 80 au. As a result, the gas is no longer in a steady-state MRI-driven accretion at t = 0 yr, unlike Model IV. Here we note that, in panel f, the dead zone outer edge coincides at t = 0 yr and t = 100 yr.
Current usage metrics show cumulative count of Article Views (full-text article views including HTML views, PDF and ePub downloads, according to the available data) and Abstracts Views on Vision4Press platform.
Data correspond to usage on the plateform after 2015. The current usage metrics is available 48-96 hours after online publication and is updated daily on week days.
Initial download of the metrics may take a while.