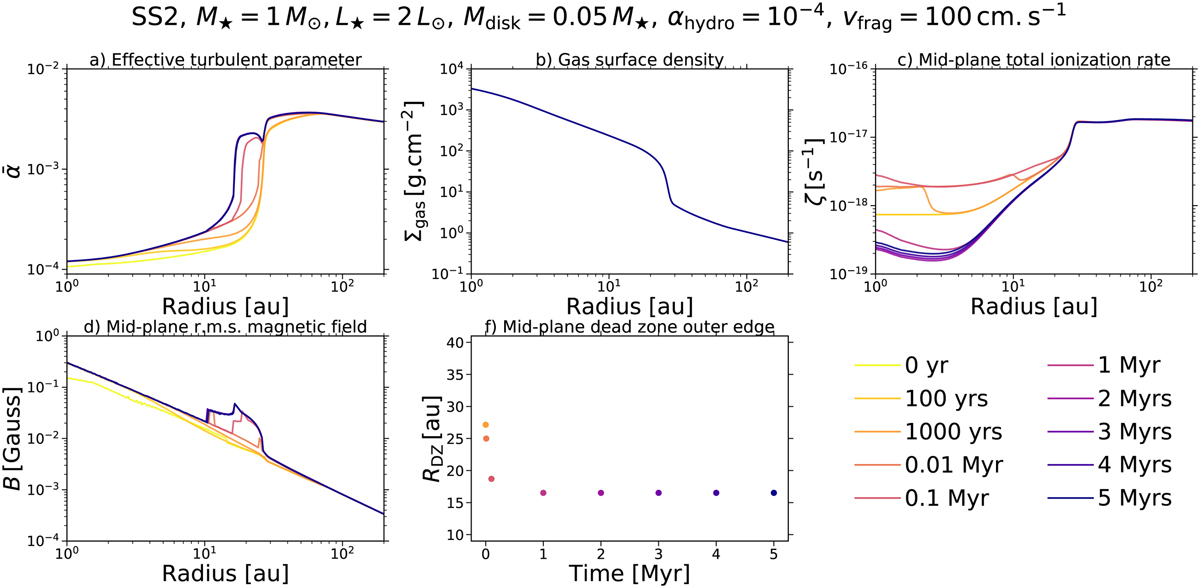
Fig. 4
Download original image
Impact of dust evolution on the MRI-driven turbulence, for Model IV. The panels show the temporal evolution of the same quantities as in Fig. 2, except for the gas accretion rate. Also, the gas surface density is now fixed to the displayed input profile in panel b. We emphasize that these quantities do not describe steady-state MRI-driven accretion (unlike Fig. 2), since they are recalculated at each dust evolution snapshot, through partial coupling between the ID radial dust evolution model employed and our MRI-driven turbulence model. On this note, the corresponding temporal evolution of the five dust quantities used to perform such a coupling are shown in Fig. 5. Here we note that, in panel f, the dead zone outer edge coincides at t = 0 yr, t = 100 yr and t = 1000 yr.
Current usage metrics show cumulative count of Article Views (full-text article views including HTML views, PDF and ePub downloads, according to the available data) and Abstracts Views on Vision4Press platform.
Data correspond to usage on the plateform after 2015. The current usage metrics is available 48-96 hours after online publication and is updated daily on week days.
Initial download of the metrics may take a while.