Fig. 3
Download original image
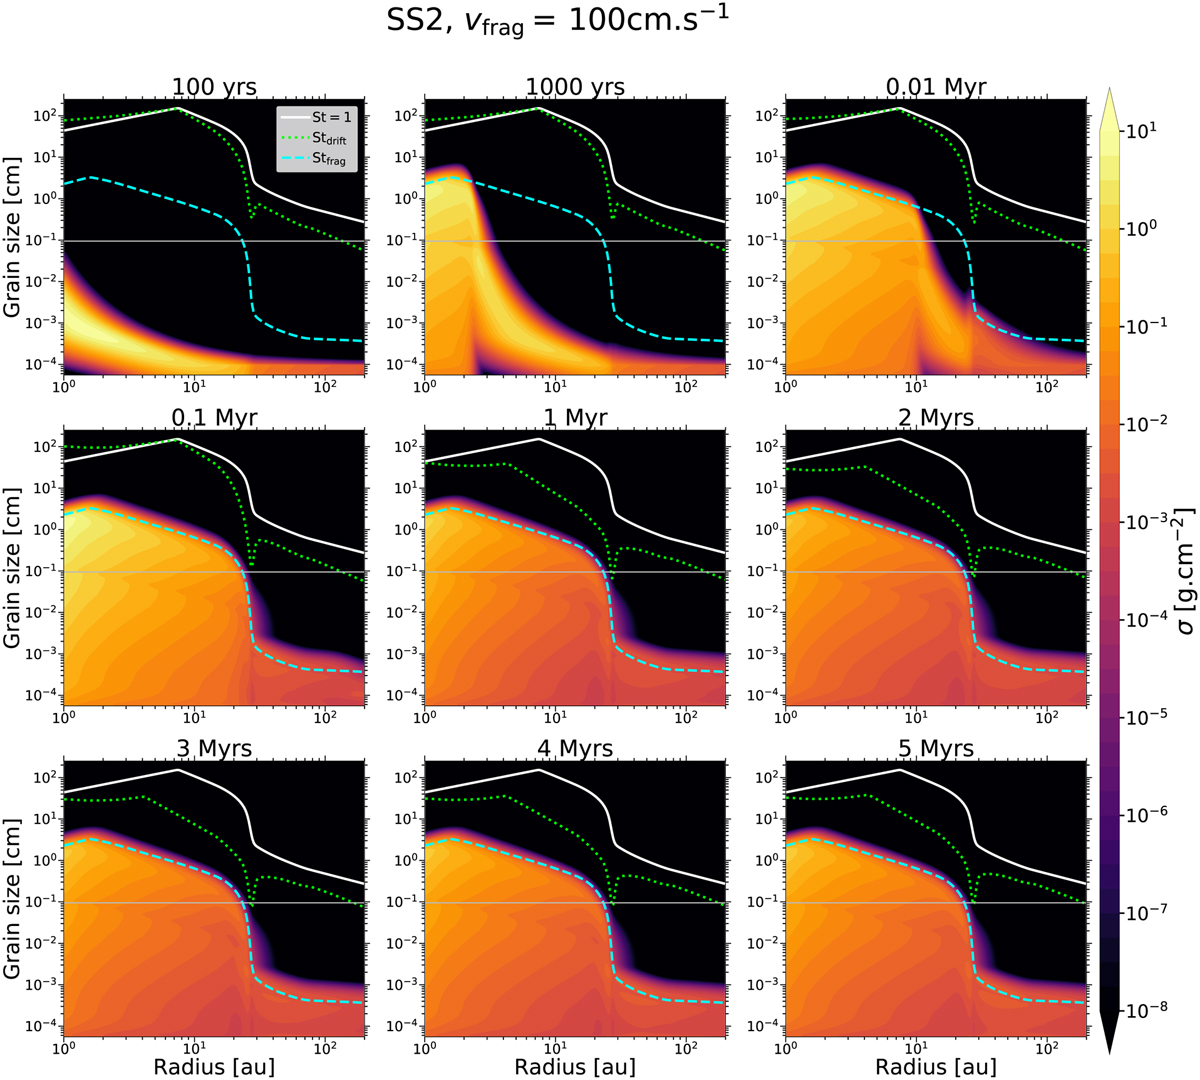
Temporal evolution of the dust surface density distribution per logarithmic bin of grain size σ(r, a) (see Eq. (C.1)), for Model IV. In each panel, the solid white line shows a Stokes number of unity (radial drift reaches its maximal efficiency), the dotted green line shows the drift limit (Eq. (19)), and the dashed cyan line shows the fragmentation limit (Eq. (20)). The horizontal solid dark gray lines show a grain size of 1 mm.
Current usage metrics show cumulative count of Article Views (full-text article views including HTML views, PDF and ePub downloads, according to the available data) and Abstracts Views on Vision4Press platform.
Data correspond to usage on the plateform after 2015. The current usage metrics is available 48-96 hours after online publication and is updated daily on week days.
Initial download of the metrics may take a while.