Fig. 1
Download original image
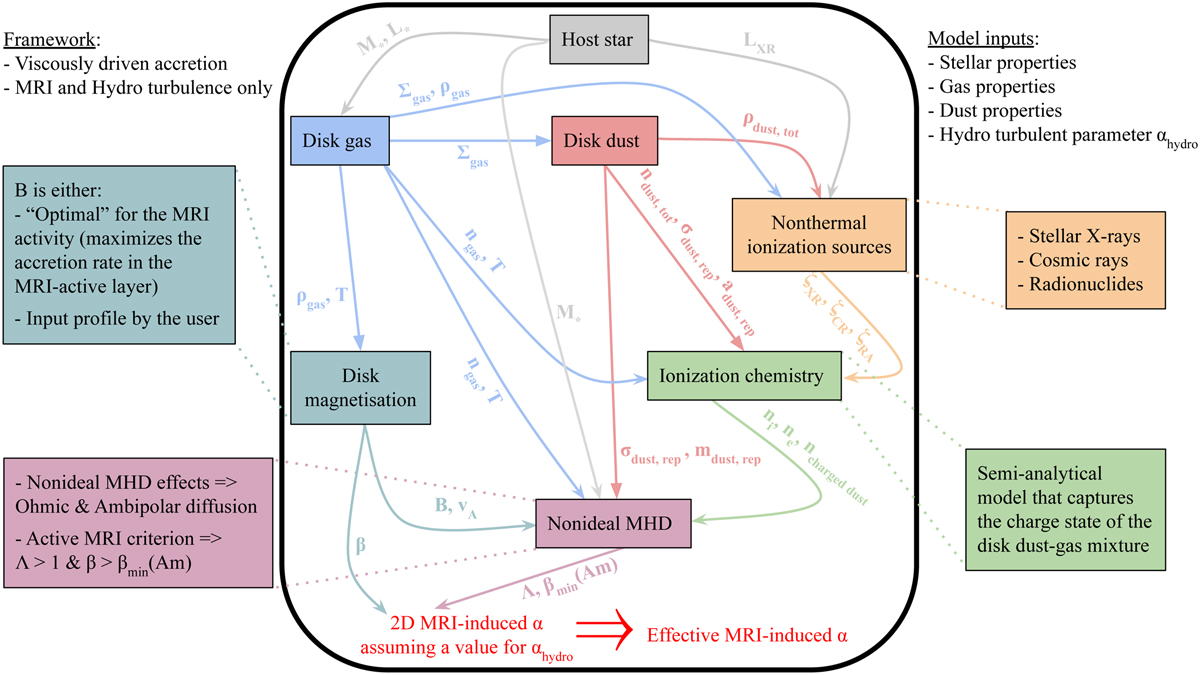
Flowchart of the MRI-driven disk accretion model presented in Delage et al. (2022). This model captures the essence of the MRI-driven turbulence in a 1+1D framework, accounting for the following: stellar properties (gray symbols), disk gas properties (blue symbols), disk dust properties (red symbols), nonthermal ionization sources (yellow symbols), ionization chemistry modeling the gas ionization degree (green symbols), disk magnetization properties (powder blue symbols), and nonideal MHD calculations (dark pink symbols). The main output of the model is an effective radial profile for the MRI-induced viscosity parameter, ᾱ (Eq. (1)). In this paper, we improve the dust phase modeling with a dust size distribution, either by assuming a fixed power-law distribution with different properties or the outputs from dust evolution obtained with DustPy (see Table 1 and text in Sect. 2.3 for further explanations).
Current usage metrics show cumulative count of Article Views (full-text article views including HTML views, PDF and ePub downloads, according to the available data) and Abstracts Views on Vision4Press platform.
Data correspond to usage on the plateform after 2015. The current usage metrics is available 48-96 hours after online publication and is updated daily on week days.
Initial download of the metrics may take a while.