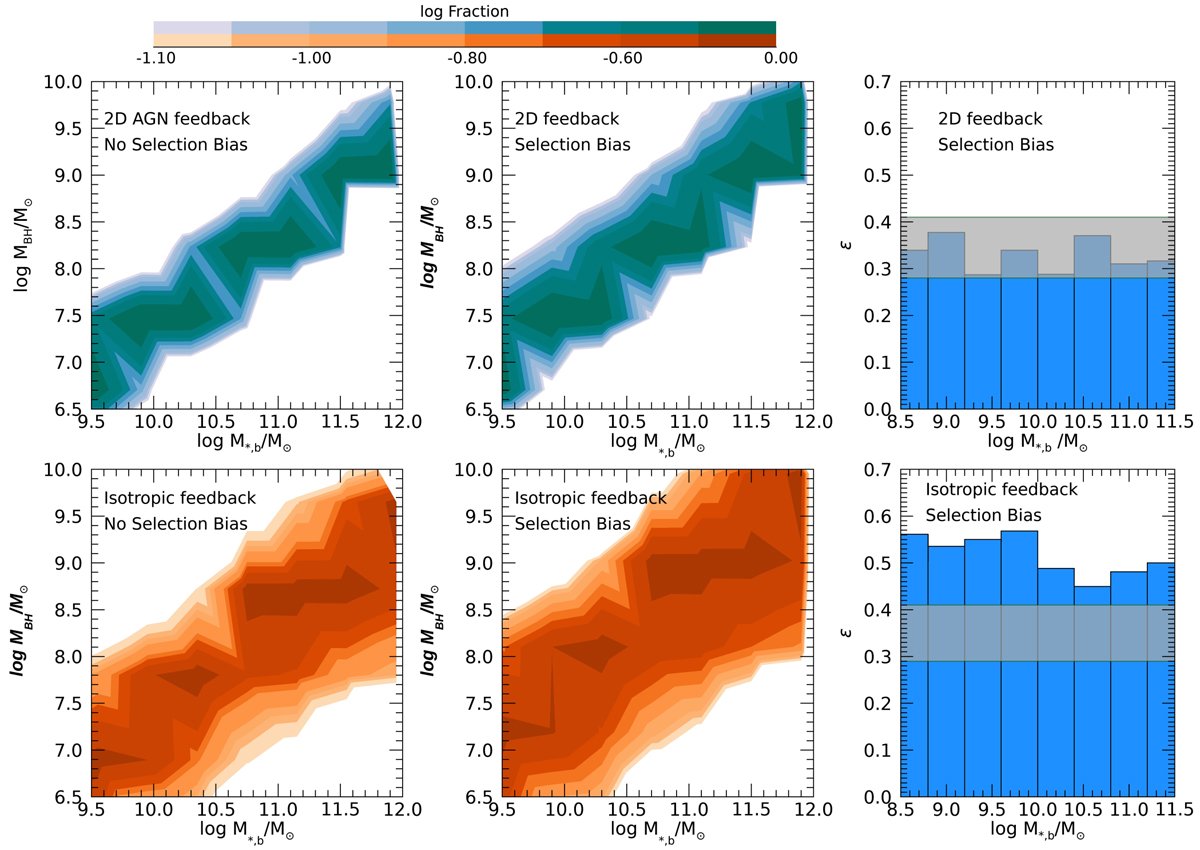
Fig. 7.
Download original image
Effect of feedback treatment on the MBH − M*, b relation. The relation predicted for galaxies at z ≤ 0.1 by our new two-dimensional model for AGN feedback (top panels) presented in Sect. 2.1 is compared with the predictions obtained with our previous isotropic treatment of feedback (bottom panels). For both AGN feedback models, we show the results with and without the selection effect discussed in Sect. 2.1, as indicated by the labels. In all panels, the color code corresponds to the logarithm of the fraction of galaxies with different MBH in a given log M*, b bin. The standard deviations ϵ for the new and previous treatment of AGN feedback is shown as a function of bulge stellar mass in the rightmost histograms. The horizontal strip represents the range of values obtained from different observational works: the upper bound is the intrinsic scatter ϵ derived by De Nicola et al. (2019), and the lower bound is the value of ϵ derived by the least-square fit analysis by Kormendy & Ho (2013) using individual errors in log σ, adding individual errors in log MBH to the intrinsic scatter in quadrature, and iterating the intrinsic scatter until the reduced χ2 = 1.
Current usage metrics show cumulative count of Article Views (full-text article views including HTML views, PDF and ePub downloads, according to the available data) and Abstracts Views on Vision4Press platform.
Data correspond to usage on the plateform after 2015. The current usage metrics is available 48-96 hours after online publication and is updated daily on week days.
Initial download of the metrics may take a while.