Fig. 6.
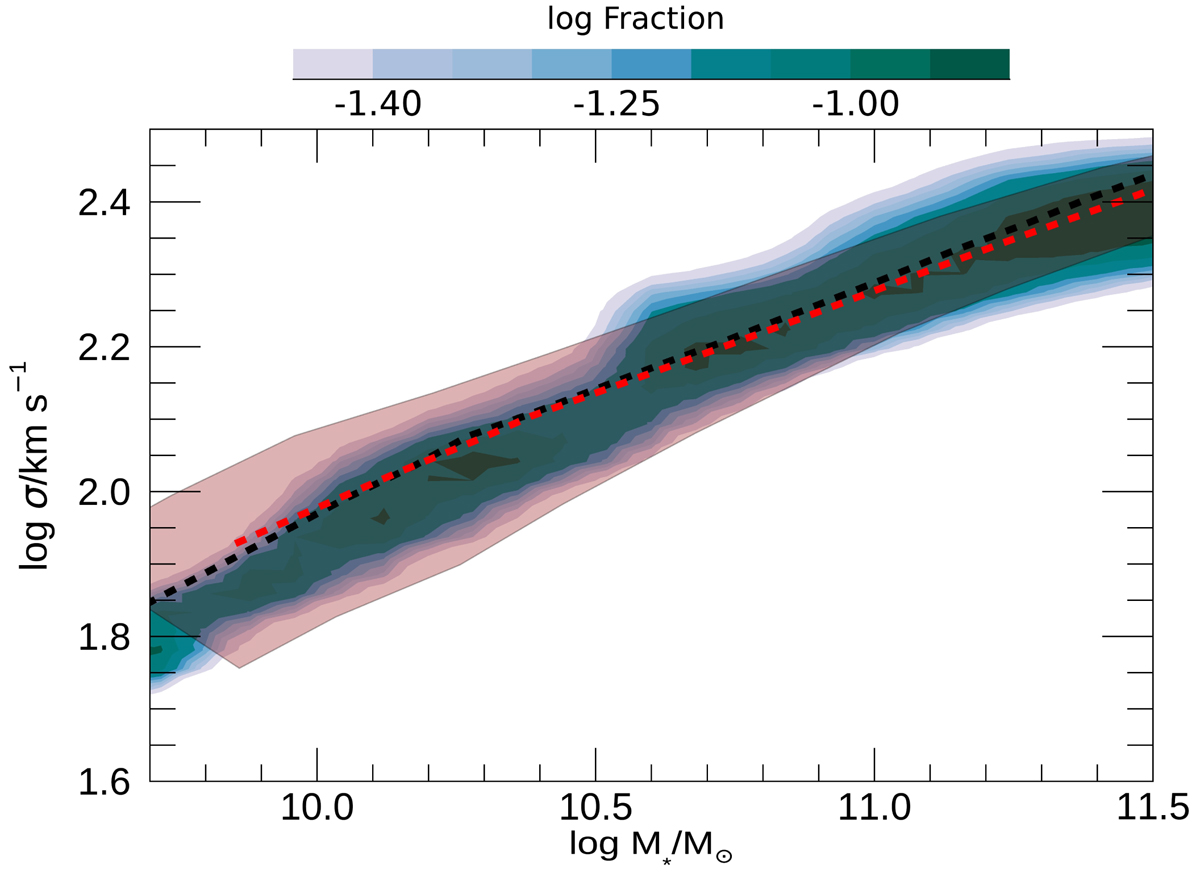
Download original image
Predicted relation between the velocity dispersion σ and the stellar mass M* for passive galaxies (see text). The color code represents the logarithm of the fraction of model galaxies with the considered σ for each bin of M*. The shaded band shows the relation for early-type galaxies selected on the basis of morphological indicators after Hyde & Bernardi (2009). The dashed black and red lines show the average relation derived by Zahid et al. (2016) for passive SDSS galaxies and for the Smithsonian Hectospec Lensing Survey (SHELS) sample, selected on the basis of spectral properties (Dn4000 > 1.5, where Dn4000 is the flux ratio of two spectral windows adjacent to the 4000 Å break (see Balogh et al. 1999).
Current usage metrics show cumulative count of Article Views (full-text article views including HTML views, PDF and ePub downloads, according to the available data) and Abstracts Views on Vision4Press platform.
Data correspond to usage on the plateform after 2015. The current usage metrics is available 48-96 hours after online publication and is updated daily on week days.
Initial download of the metrics may take a while.