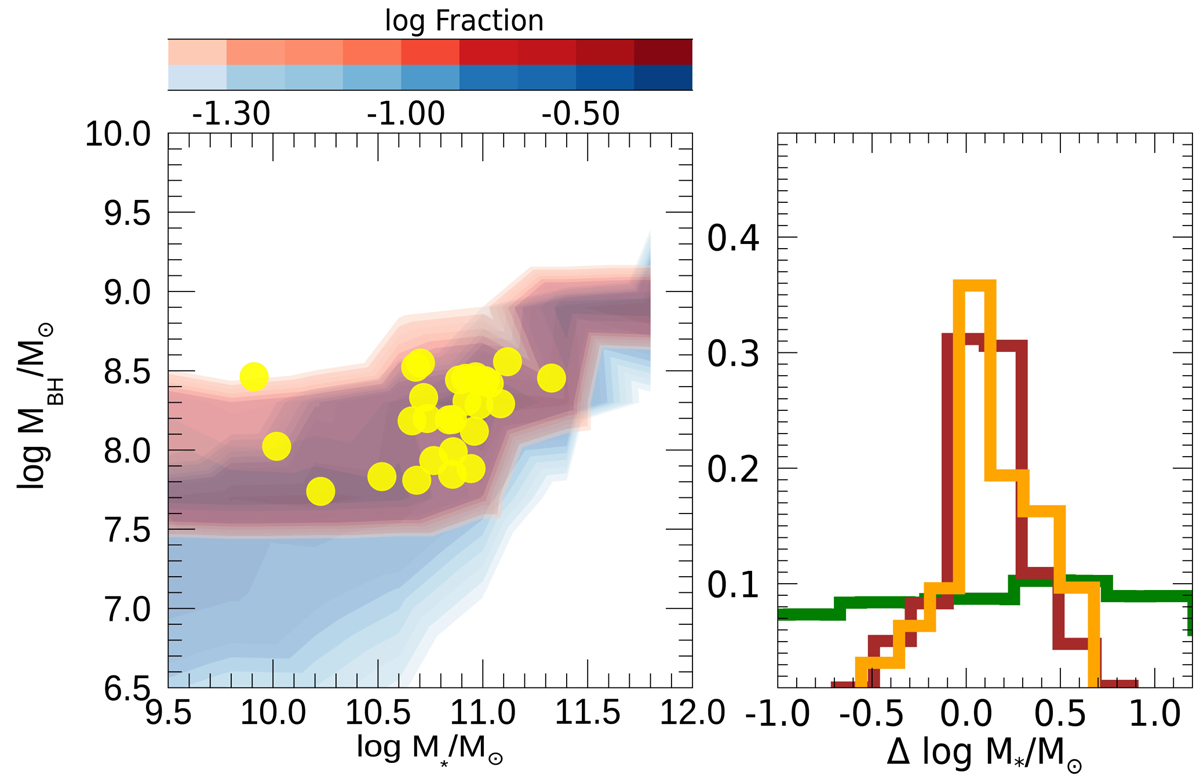
Fig. 13.
Download original image
Model predictions for the evolution of the MBH − M* relation. Left panel: comparison of the observed (orange dots) and predicted MBH − M* relation for galaxies in the redshift range 1.2 ≤ z ≤ 1.7. The color code corresponds to the logarithm of the fraction of galaxies with different MBH in a given log M* bin. The data are taken from Ding et al. (2020). The total predicted distribution of model galaxies in the MBH − M* plane is shown by the blue contours, and the red region corresponds to the subsample of model galaxies that satisfies the same selection criteria as the observations. Right panel: distribution of the residuals for the observations (orange histogram), the model galaxies (blue histogram), and the model galaxies resulting in simulations with the isotropic feedback model implemented in previous versions of our SAM (green histogram, taken from Ding et al. 2020). Model galaxies are selected so as to mimic the observational measurement errors and selection effects (see text).
Current usage metrics show cumulative count of Article Views (full-text article views including HTML views, PDF and ePub downloads, according to the available data) and Abstracts Views on Vision4Press platform.
Data correspond to usage on the plateform after 2015. The current usage metrics is available 48-96 hours after online publication and is updated daily on week days.
Initial download of the metrics may take a while.