Fig. 11.
Download original image
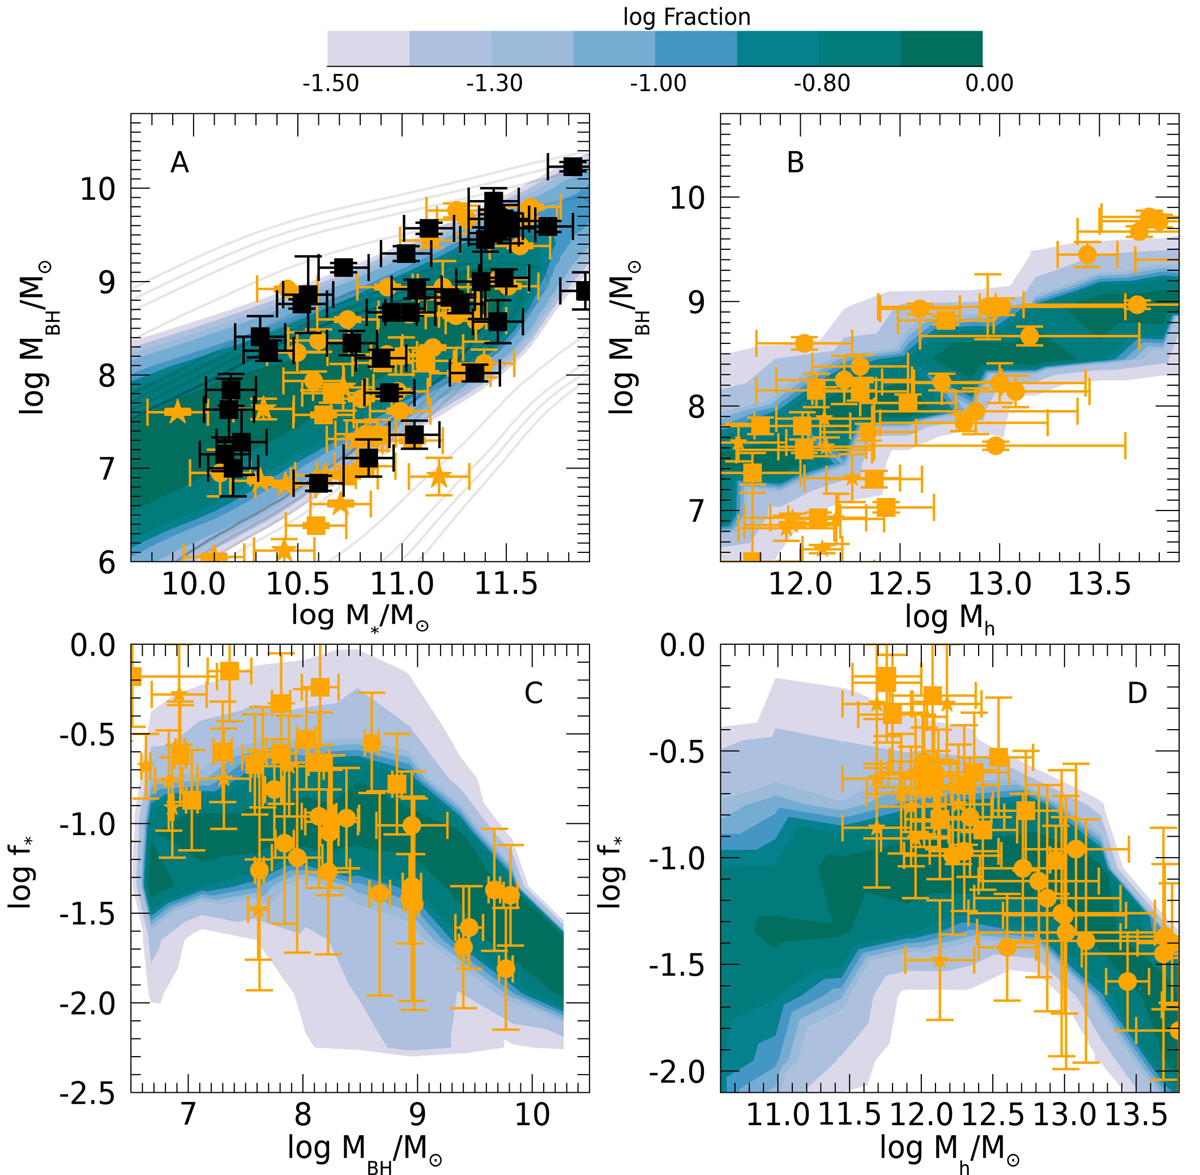
Predicted relations between MBH and the stellar and DM properties of the host galaxies. The MBH − M* relation (panel A), the MBH − Mh relation (panel B), the f* − MBH relation (panel C), and the f* − Mh relation (panel D) are compared with the data from Marasco et al. (2021; orange points). In panel A we also report data from Sahu et al. (2019a,b; black dots). The gray contours show the predictions of our model in the absence of AGN feedback. In all panels and for each abscissa value, the color code corresponds to the logarithm of the fraction of galaxies with different values of the quantities in the y-axis.
Current usage metrics show cumulative count of Article Views (full-text article views including HTML views, PDF and ePub downloads, according to the available data) and Abstracts Views on Vision4Press platform.
Data correspond to usage on the plateform after 2015. The current usage metrics is available 48-96 hours after online publication and is updated daily on week days.
Initial download of the metrics may take a while.