Fig. 9.
Download original image
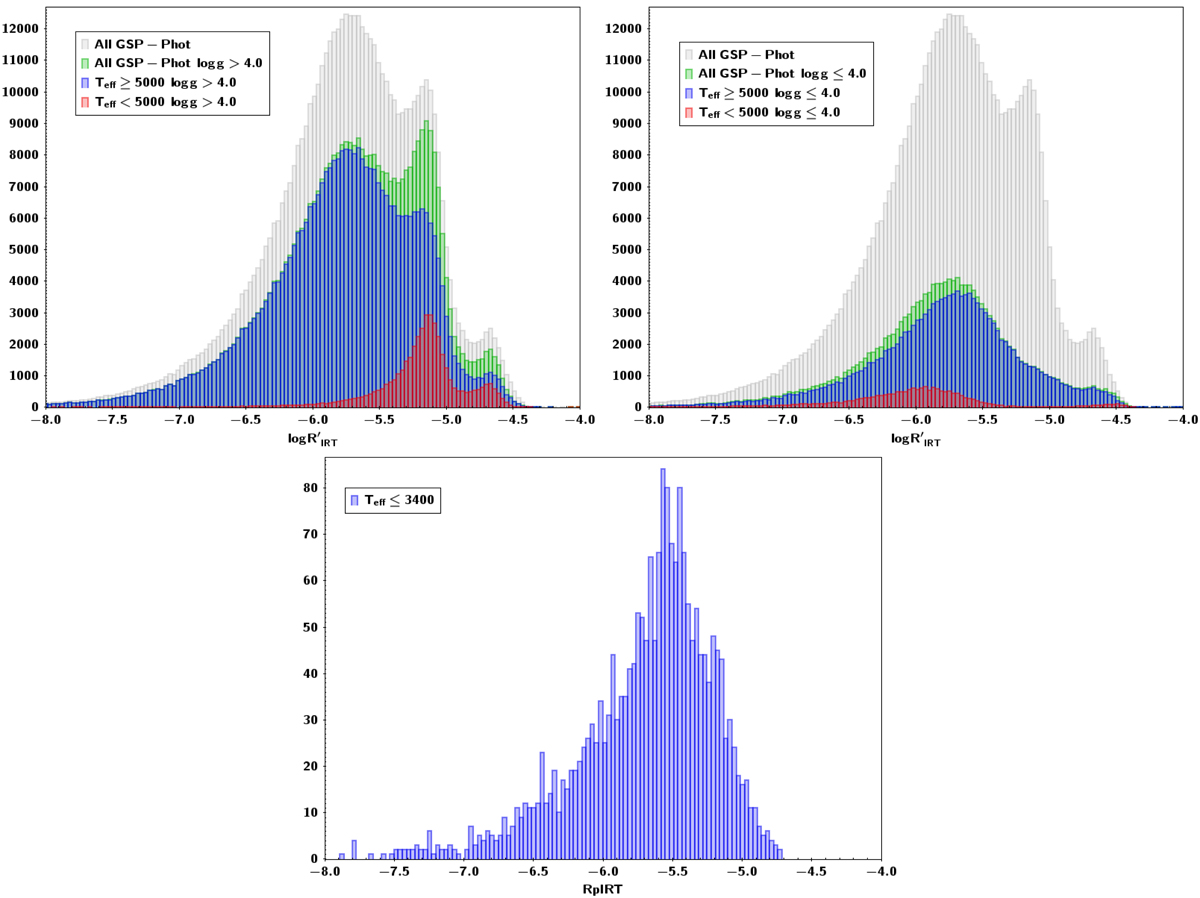
![]() histograms (bin size 0.03) for log g > 4.0 (upper left panel) and log g ≤ 4.0 (upper right panel). Upper panels: the distribution for Teff ≥ 5000 K and Teff < 5000 K are compared with the global distributions. The distribution for Teff ≲ 3400 K (fully convective stars) is shown in the bottom panel. In order to extend the comparison to the very active branch on an homogeneous set, only results with GSP-Phot input are visualised.
histograms (bin size 0.03) for log g > 4.0 (upper left panel) and log g ≤ 4.0 (upper right panel). Upper panels: the distribution for Teff ≥ 5000 K and Teff < 5000 K are compared with the global distributions. The distribution for Teff ≲ 3400 K (fully convective stars) is shown in the bottom panel. In order to extend the comparison to the very active branch on an homogeneous set, only results with GSP-Phot input are visualised.
Current usage metrics show cumulative count of Article Views (full-text article views including HTML views, PDF and ePub downloads, according to the available data) and Abstracts Views on Vision4Press platform.
Data correspond to usage on the plateform after 2015. The current usage metrics is available 48-96 hours after online publication and is updated daily on week days.
Initial download of the metrics may take a while.