Fig. 8.
Download original image
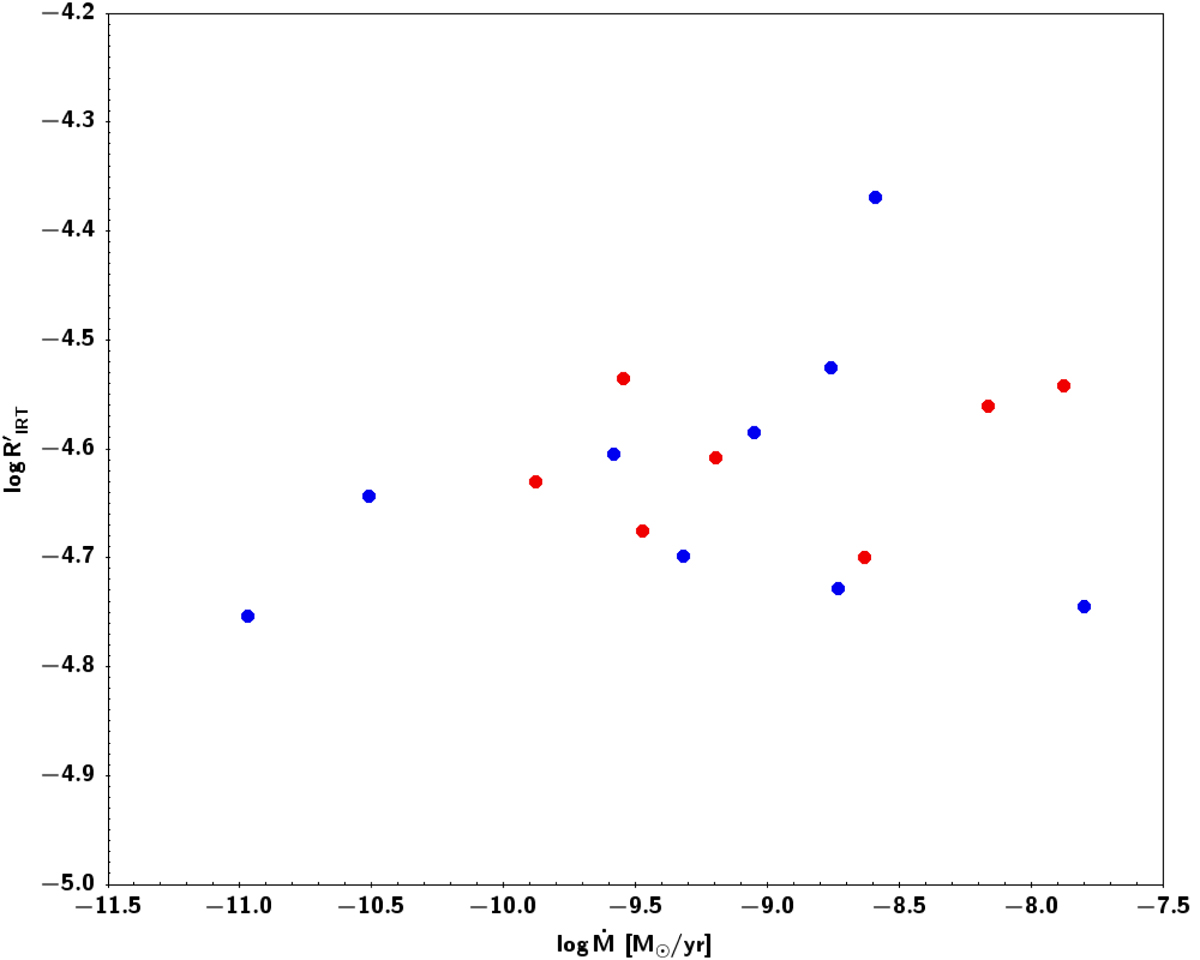
Activity index (![]() ) vs. accretion rate (log Ṁ) for selected sources. Red filled circles indicate accretion rates derived from the width of Hα at 10% of the peak by the Gaia-ESO survey (Lanzafame et al. 2015, and references therein). Blue filled circles indicate accretion rates derived from the excess continuum emission (see, e.g. Manara et al. 2015). See Table 2 for the sources of the accretion rate estimates.
) vs. accretion rate (log Ṁ) for selected sources. Red filled circles indicate accretion rates derived from the width of Hα at 10% of the peak by the Gaia-ESO survey (Lanzafame et al. 2015, and references therein). Blue filled circles indicate accretion rates derived from the excess continuum emission (see, e.g. Manara et al. 2015). See Table 2 for the sources of the accretion rate estimates.
Current usage metrics show cumulative count of Article Views (full-text article views including HTML views, PDF and ePub downloads, according to the available data) and Abstracts Views on Vision4Press platform.
Data correspond to usage on the plateform after 2015. The current usage metrics is available 48-96 hours after online publication and is updated daily on week days.
Initial download of the metrics may take a while.