Fig. 7.
Download original image
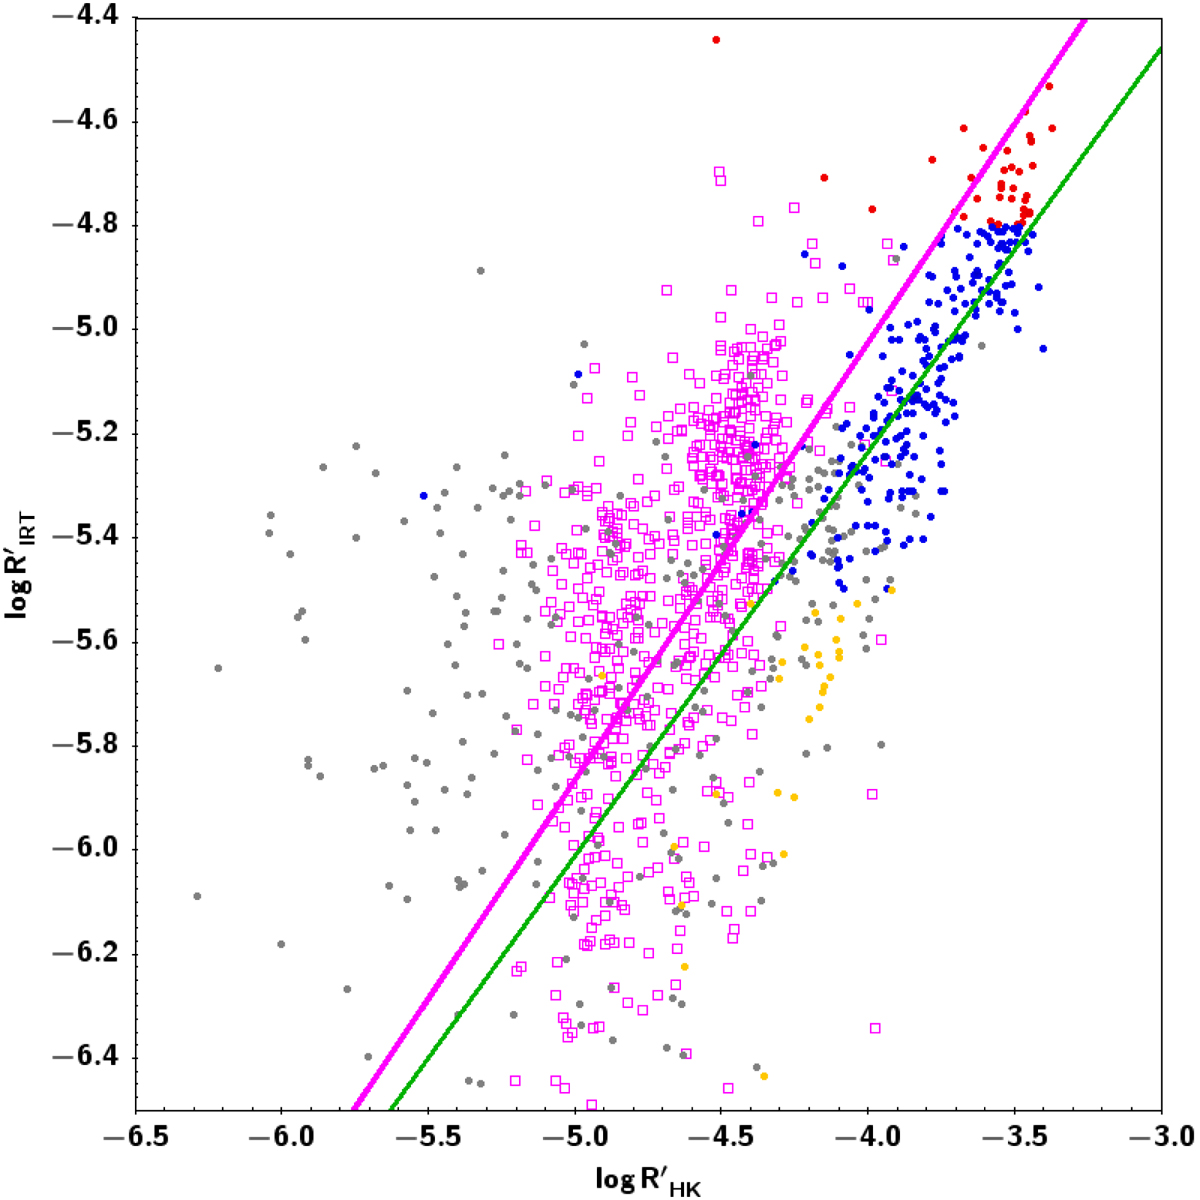
Comparison of ![]() vs.
vs. ![]() obtained from ESO-FEROS archive spectra and with
obtained from ESO-FEROS archive spectra and with ![]() from Boro Saikia et al. (2018). Stars with
from Boro Saikia et al. (2018). Stars with ![]() obtained from GSP-Phot input and placed in the HA-branch are plotted in blue, those in the VHA-branch in red, and those in the LA-branch in orange. Stars with
obtained from GSP-Phot input and placed in the HA-branch are plotted in blue, those in the VHA-branch in red, and those in the LA-branch in orange. Stars with ![]() obtained from GSP-Spec input are plotted in grey. The linear fit to data with GSP-Phot input is plotted in green (Eq. (8)). The comparison with
obtained from GSP-Spec input are plotted in grey. The linear fit to data with GSP-Phot input is plotted in green (Eq. (8)). The comparison with ![]() from Boro Saikia et al. (2018) is shown with open purple squares, and the corresponding linear fit with a purple line (Eq. (9)).
from Boro Saikia et al. (2018) is shown with open purple squares, and the corresponding linear fit with a purple line (Eq. (9)).
Current usage metrics show cumulative count of Article Views (full-text article views including HTML views, PDF and ePub downloads, according to the available data) and Abstracts Views on Vision4Press platform.
Data correspond to usage on the plateform after 2015. The current usage metrics is available 48-96 hours after online publication and is updated daily on week days.
Initial download of the metrics may take a while.