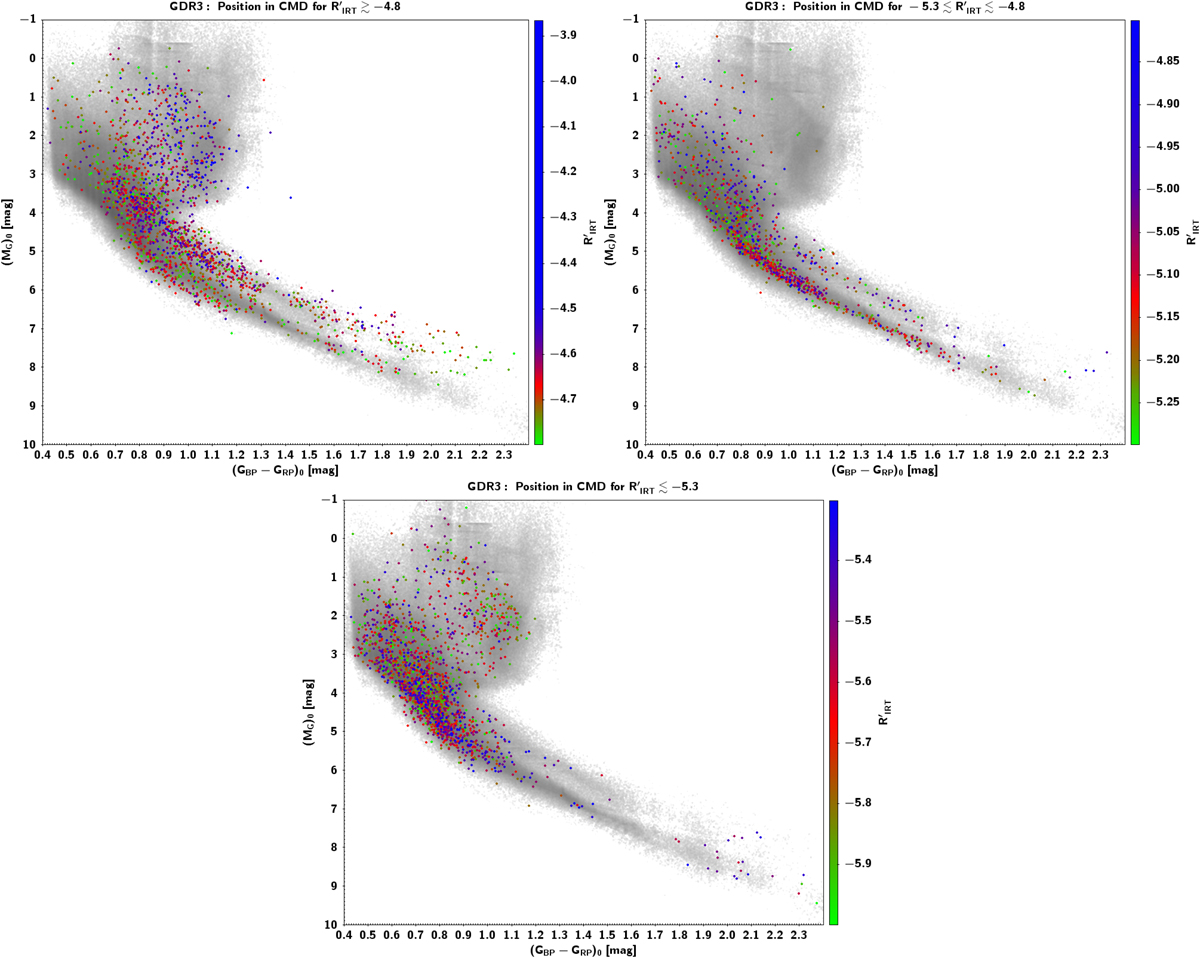
Fig. 6.
Download original image
Position in the CMD, corrected for interstellar extinction, of stars in the VHA (upper left panel), HA (upper right panel) and LA (lower panel) branches. Input APs are from GSP-Phot. The density plot of all sources for which the activity index has been derived is shown in grey on the background. The position of subsamples of ∼2000 stars per branch are shown in each panel, colour coded according to ![]() . See text for details.
. See text for details.
Current usage metrics show cumulative count of Article Views (full-text article views including HTML views, PDF and ePub downloads, according to the available data) and Abstracts Views on Vision4Press platform.
Data correspond to usage on the plateform after 2015. The current usage metrics is available 48-96 hours after online publication and is updated daily on week days.
Initial download of the metrics may take a while.