Fig. 5.
Download original image
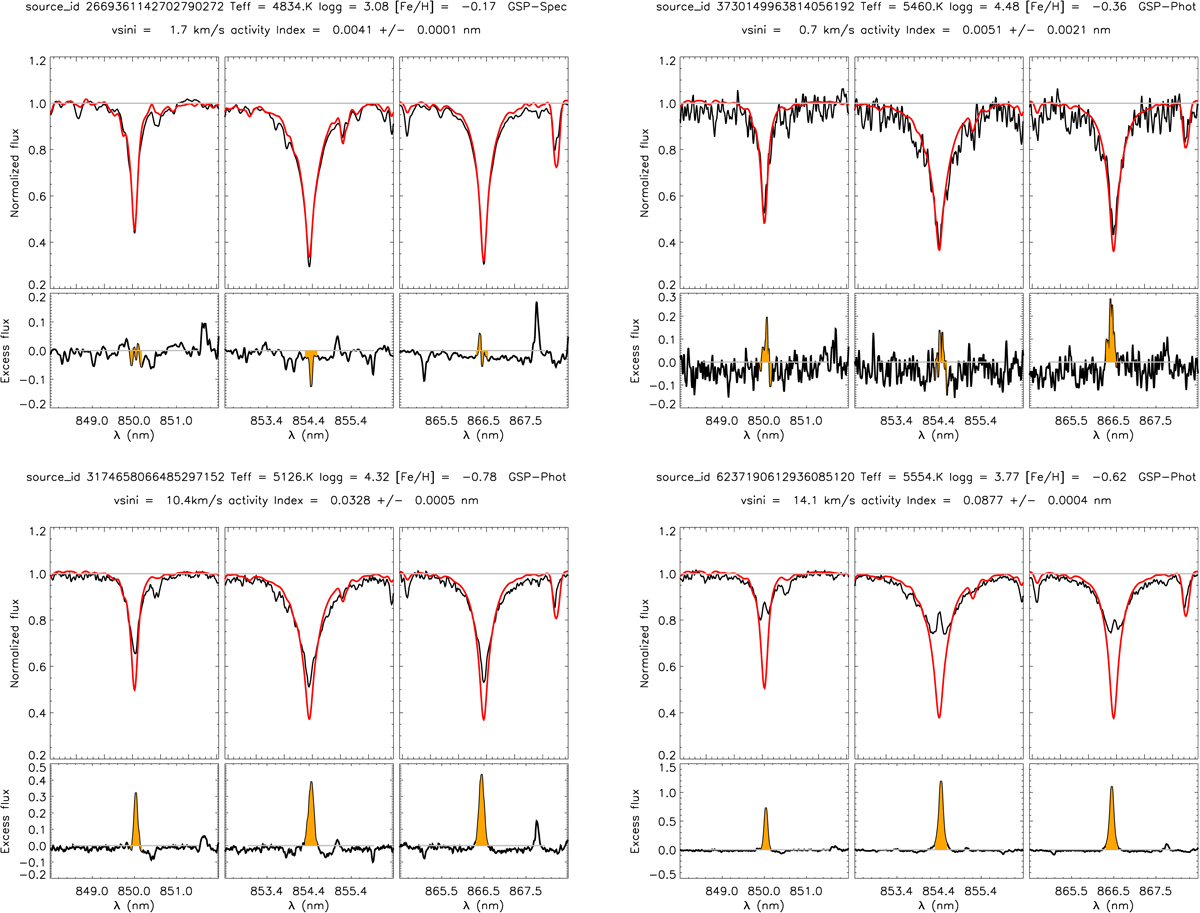
Ca II IRT sample spectra in the different regimes. In each panel, the spectra (black line) are compared with the template (red line). The enhancement factor, i.e. the integrand of Eq. (1), is reported below the spectrum, and the integral producing α is outlined in orange. Upper left panel: LA subgiant with ![]() . Upper right panel: LA dwarf with
. Upper right panel: LA dwarf with ![]() . Lower left panel: HA dwarf with
. Lower left panel: HA dwarf with ![]() . Lower right panel: accreting star (one in the Upper Scorpius association reported in Table 2 and Fig. 8) in the VHA regime.
. Lower right panel: accreting star (one in the Upper Scorpius association reported in Table 2 and Fig. 8) in the VHA regime.
Current usage metrics show cumulative count of Article Views (full-text article views including HTML views, PDF and ePub downloads, according to the available data) and Abstracts Views on Vision4Press platform.
Data correspond to usage on the plateform after 2015. The current usage metrics is available 48-96 hours after online publication and is updated daily on week days.
Initial download of the metrics may take a while.