Fig. 4.
Download original image
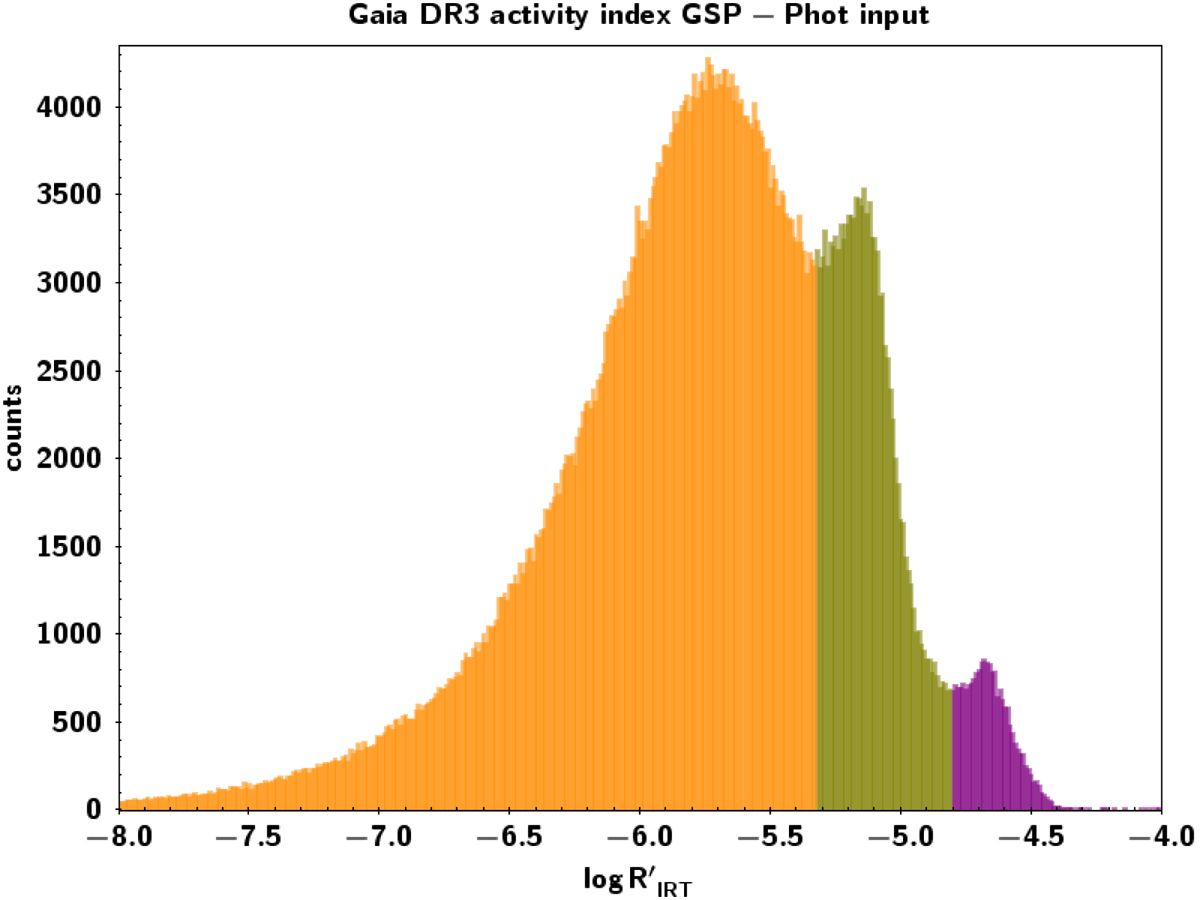
Histogram of ![]() with input from GSP-Phot (bin size 0.01). The highest branch (VHA) is shown in purple and has a lower limit of between −4.8 and −5.0, depending on Teff. The second highest branch (HA) is shown in green and has a lower limit of between −5.3 and −5.5 depending on Teff. The remainder of the distribution (LA) is shown in orange.
with input from GSP-Phot (bin size 0.01). The highest branch (VHA) is shown in purple and has a lower limit of between −4.8 and −5.0, depending on Teff. The second highest branch (HA) is shown in green and has a lower limit of between −5.3 and −5.5 depending on Teff. The remainder of the distribution (LA) is shown in orange.
Current usage metrics show cumulative count of Article Views (full-text article views including HTML views, PDF and ePub downloads, according to the available data) and Abstracts Views on Vision4Press platform.
Data correspond to usage on the plateform after 2015. The current usage metrics is available 48-96 hours after online publication and is updated daily on week days.
Initial download of the metrics may take a while.