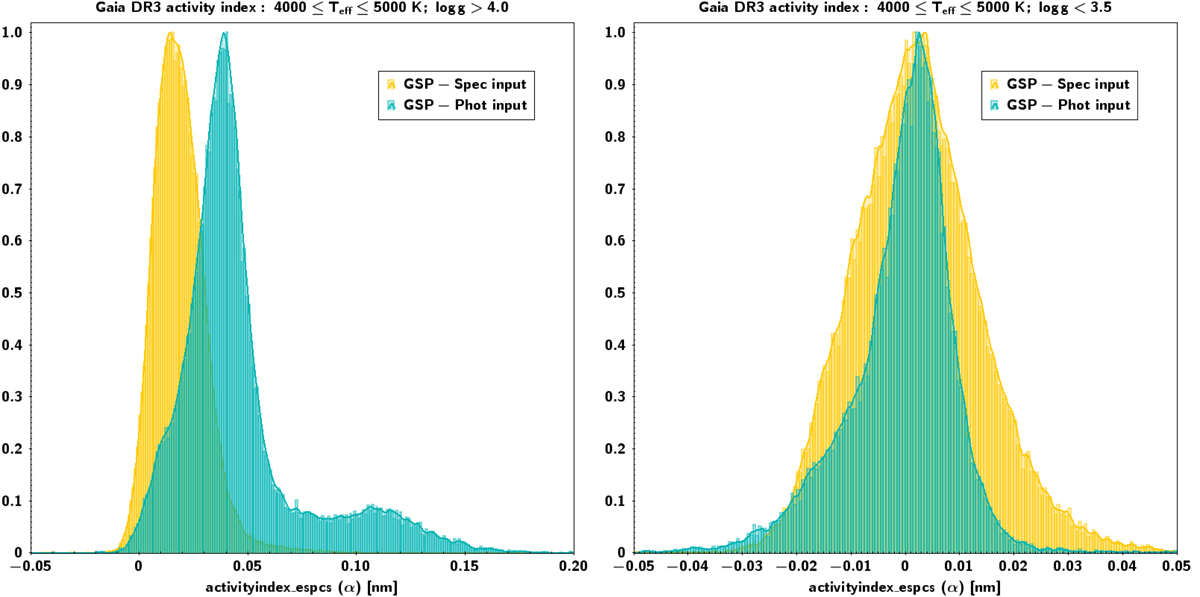
Fig. 2.
Download original image
Activity index histogram (bin size 0.001 nm, with KDE superimposed) normalised to peak values of stars with Teff ∈ (4000 K, 5000 K). Left panel: stars with log g > 4.0 (dwarfs) and right panel: stars with log g ∈ (3.0, 3.5). From this latter we estimate an upper limit to the true dispersion of the sample of 0.011 nm and 0.006 nm for the GSP-Spec and GSP-Phot input respectively, and an upper limit to the true bias of ≃0.002 nm (see text for details).
Current usage metrics show cumulative count of Article Views (full-text article views including HTML views, PDF and ePub downloads, according to the available data) and Abstracts Views on Vision4Press platform.
Data correspond to usage on the plateform after 2015. The current usage metrics is available 48-96 hours after online publication and is updated daily on week days.
Initial download of the metrics may take a while.