Fig. 10.
Download original image
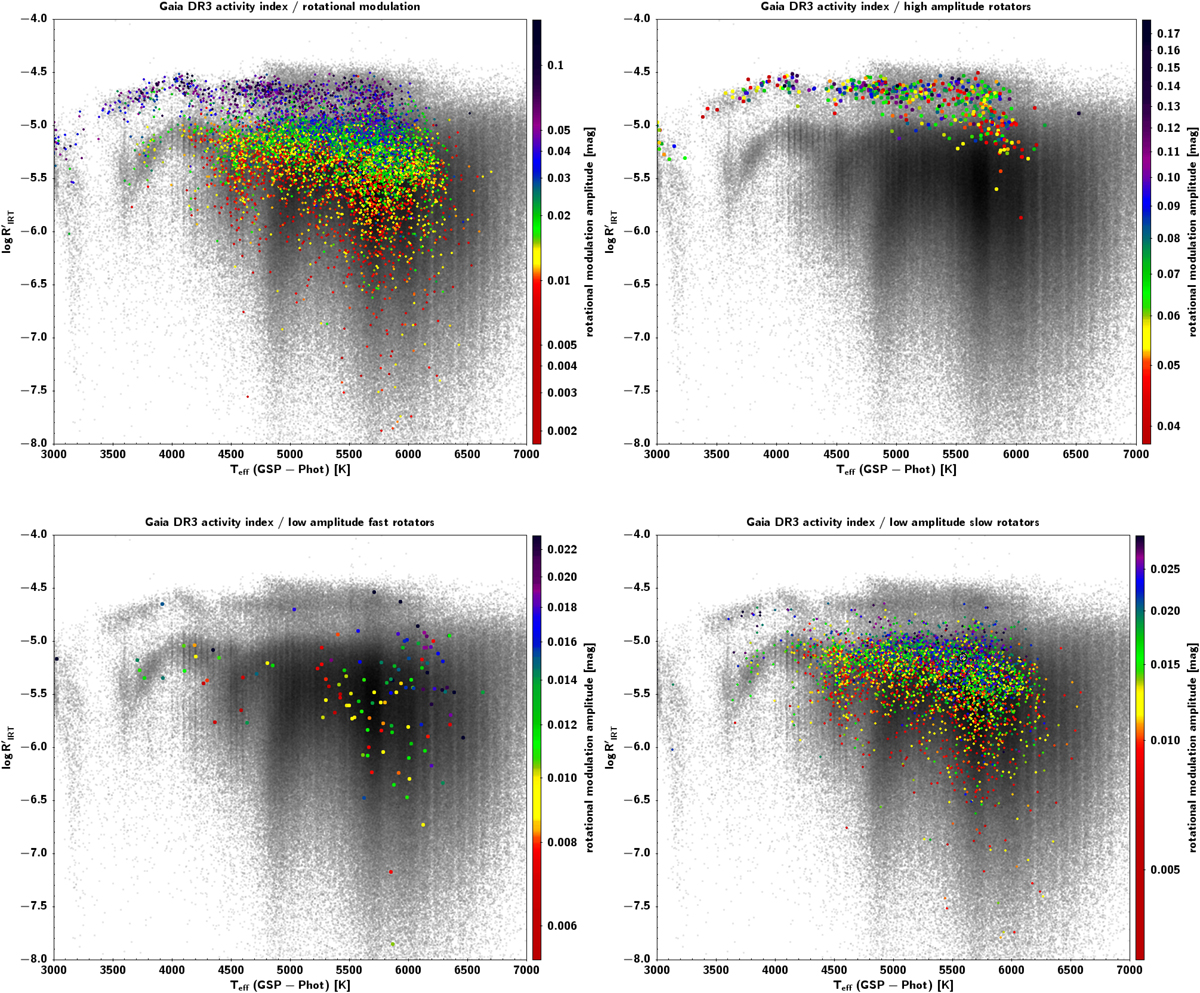
![]() vs. Teff density diagram from (Teff from GSP-Phot) with Gaia DR3 rotational modulation data overlaid (8171 sources in common). Top left panel: comparison with the whole rotational modulation dataset colour-coded according to the rotational modulation amplitude A. Top right panel: same as top left panel for just the high-amplitude rotator (HAR) branch. Bottom left panel: same as top left panel for just the low-amplitude fast-rotator (LAFR) branch. Bottom right panel: same as top left panel for just the low-amplitude slow-rotator (LASR) branch.
vs. Teff density diagram from (Teff from GSP-Phot) with Gaia DR3 rotational modulation data overlaid (8171 sources in common). Top left panel: comparison with the whole rotational modulation dataset colour-coded according to the rotational modulation amplitude A. Top right panel: same as top left panel for just the high-amplitude rotator (HAR) branch. Bottom left panel: same as top left panel for just the low-amplitude fast-rotator (LAFR) branch. Bottom right panel: same as top left panel for just the low-amplitude slow-rotator (LASR) branch.
Current usage metrics show cumulative count of Article Views (full-text article views including HTML views, PDF and ePub downloads, according to the available data) and Abstracts Views on Vision4Press platform.
Data correspond to usage on the plateform after 2015. The current usage metrics is available 48-96 hours after online publication and is updated daily on week days.
Initial download of the metrics may take a while.