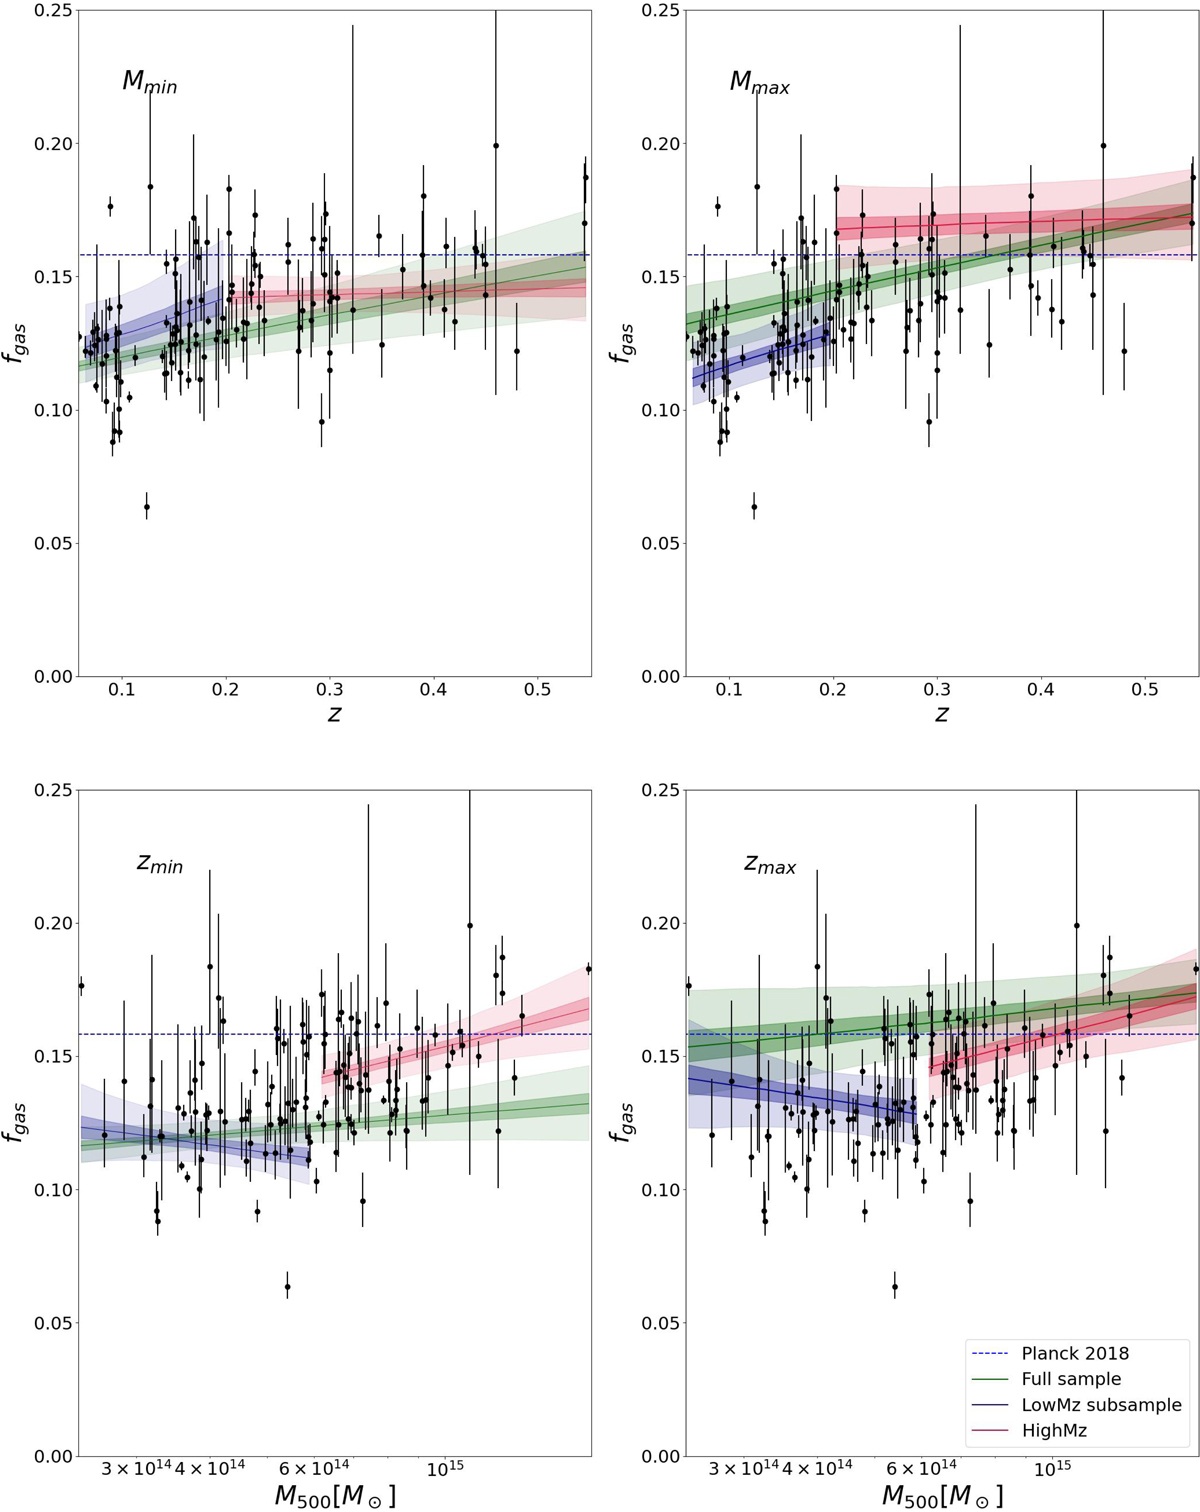
Fig. 6.
Download original image
Fits obtained from our analysis, for the different mass- and redshift-selected samples. The results in the top two panels are represented with respect to redshift at constant mass (respectively minimal and maximal masses of the full sample), while the bottom two panels are the results presented with respect to mass, at a fixed redshift (respectively minimal and maximal redshifts of the full sample). The shaded areas around the curves mark the 68% and 95% confidence levels. The blue dashed line marks the reference value Ωb/Ωm = 0.156.
Current usage metrics show cumulative count of Article Views (full-text article views including HTML views, PDF and ePub downloads, according to the available data) and Abstracts Views on Vision4Press platform.
Data correspond to usage on the plateform after 2015. The current usage metrics is available 48-96 hours after online publication and is updated daily on week days.
Initial download of the metrics may take a while.