Open Access
Fig. 2.
Download original image
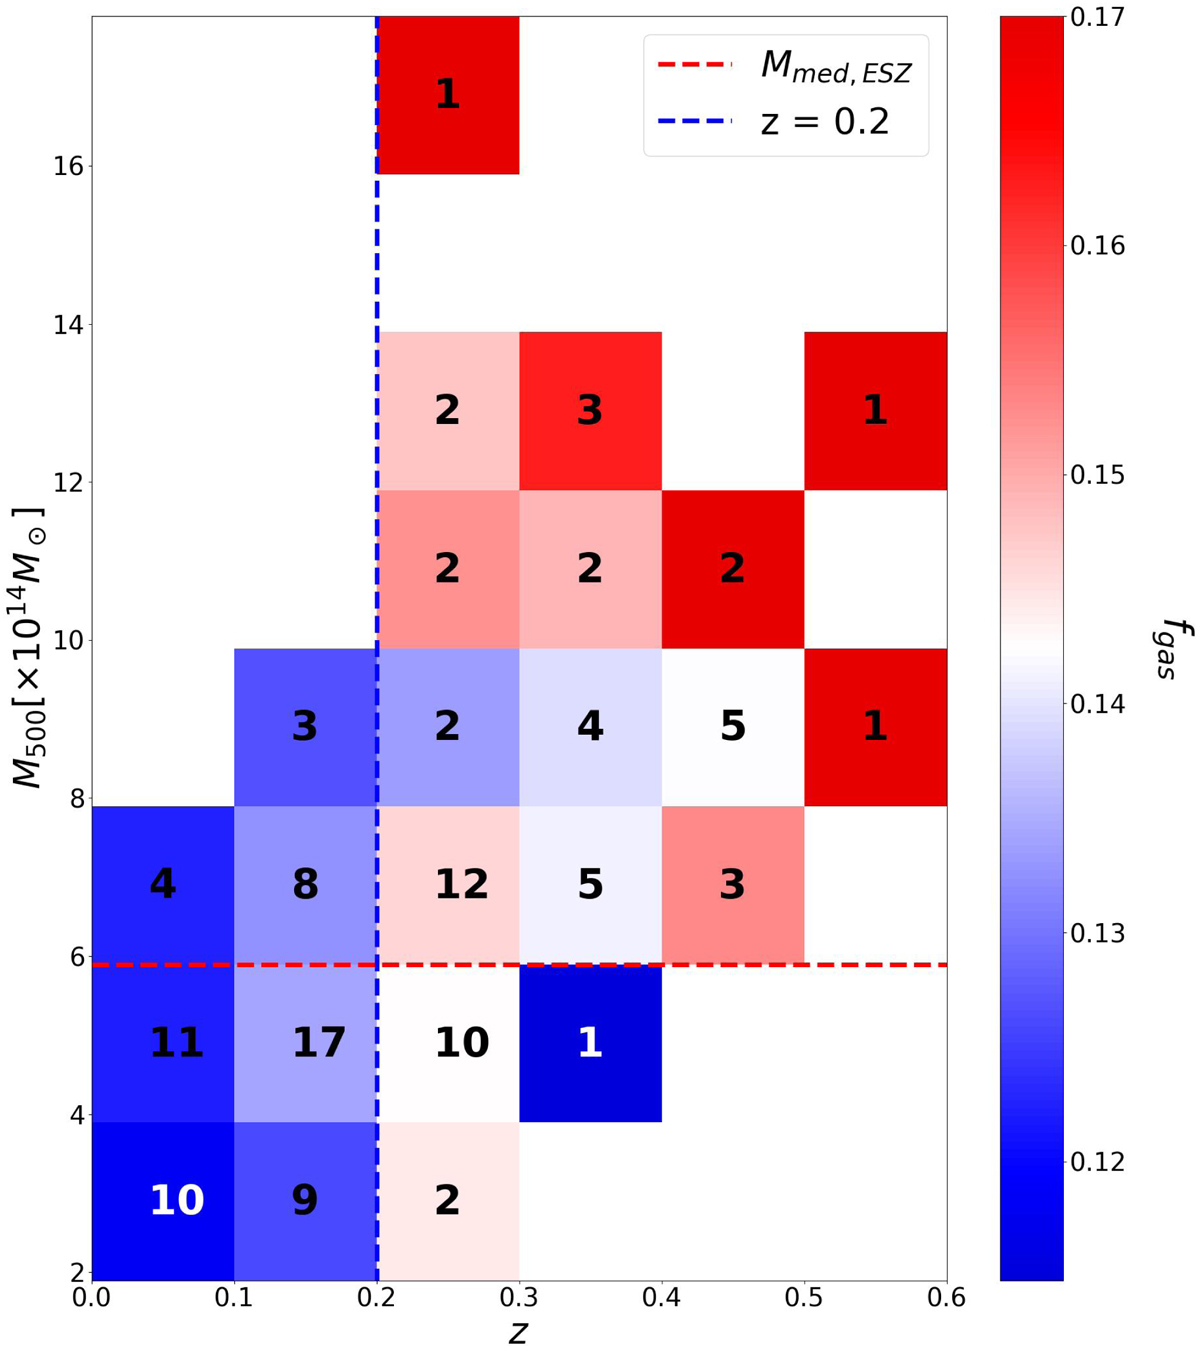
Binned mass-redshift plane of the Planck-ESZ sample. Inside each bin we compute the mean value of fgas. We show the number of clusters included in each bin and mark the delimitation of each subsample.
Current usage metrics show cumulative count of Article Views (full-text article views including HTML views, PDF and ePub downloads, according to the available data) and Abstracts Views on Vision4Press platform.
Data correspond to usage on the plateform after 2015. The current usage metrics is available 48-96 hours after online publication and is updated daily on week days.
Initial download of the metrics may take a while.