Fig. 11.

Download original image
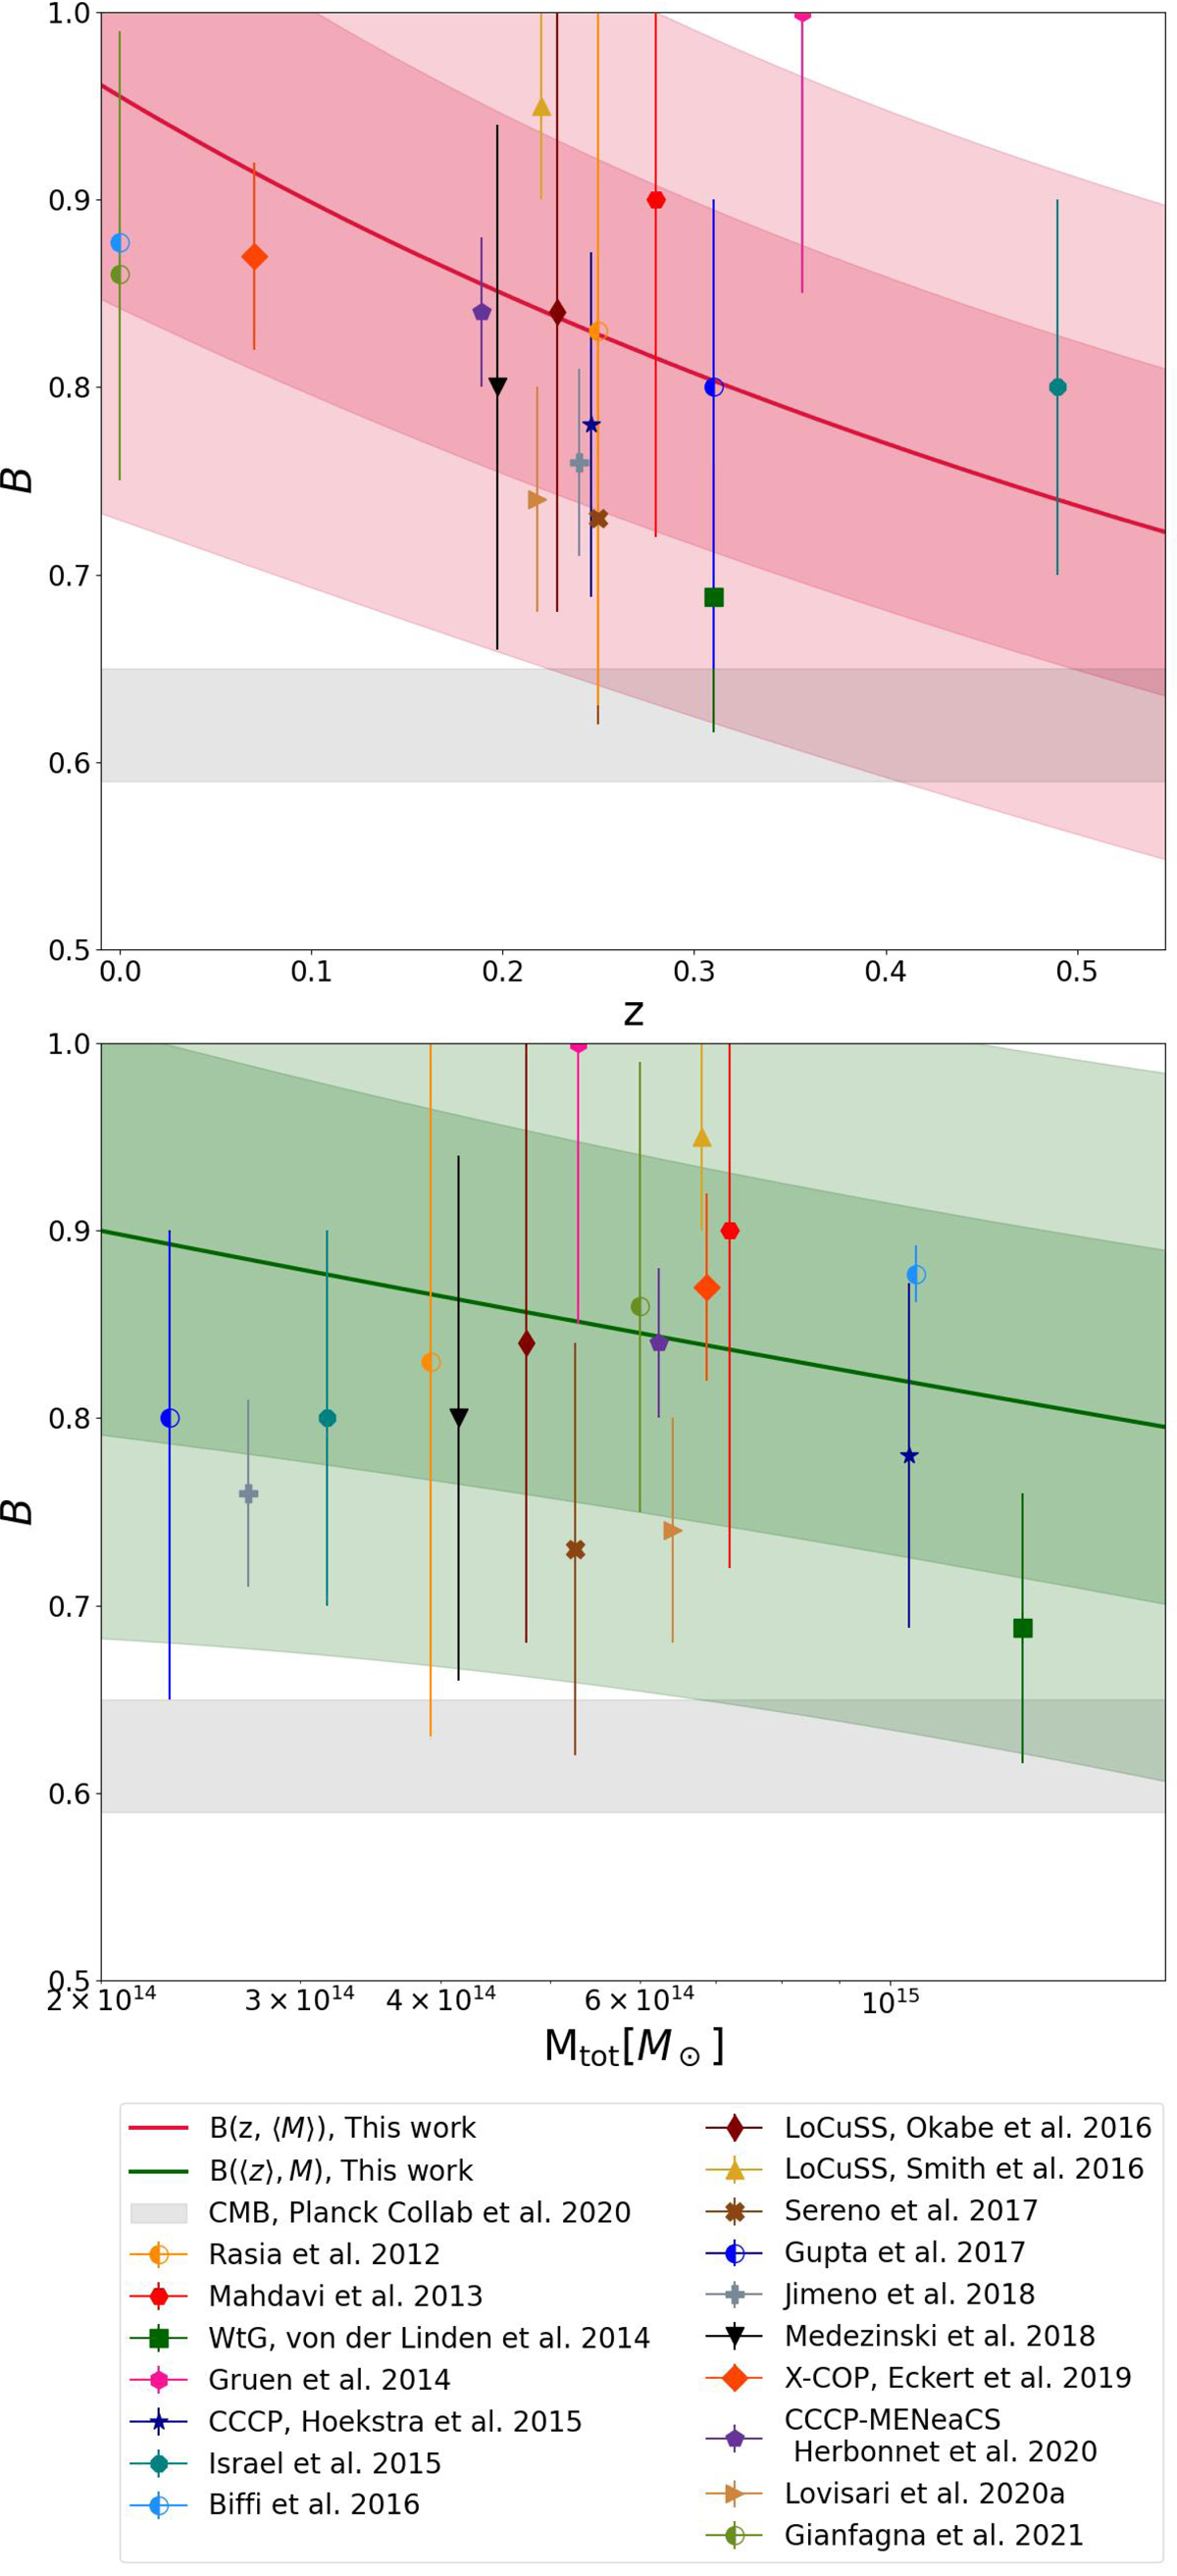
Comparison of our value of the mass bias depending on mass and redshift with other works in X-ray, weak lensing, and hydrodynamical simulations. In both panels, the shaded areas mark the 1 and 2σ confidence levels and the gray band marks the value preferred by CMB observations of B = 0.62 ± 0.003. The half-filled circles are hydrodynamical simulation works. Other points represent works based on observations. Top: value of the bias depending on redshift, computed for the mean mass of our sample. Bottom: value of the bias depending on mass, computed at the mean redshift of our sample. References: Rasia et al. (2012), Mahdavi et al. (2013), von der Linden et al. (2014), Gruen et al. (2014), Hoekstra et al. (2015), Israel et al. (2015), Biffi et al. (2016), Okabe & Smith (2016), Smith et al. (2016), Sereno et al. (2017), Gupta et al. (2017), Jimeno et al. (2018), Medezinski et al. (2018), Eckert et al. (2019), Salvati et al. (2019), Herbonnet et al. (2020), Lovisari et al. (2020b), Planck Collaboration VI (2020), Gianfagna et al. (2021).
Current usage metrics show cumulative count of Article Views (full-text article views including HTML views, PDF and ePub downloads, according to the available data) and Abstracts Views on Vision4Press platform.
Data correspond to usage on the plateform after 2015. The current usage metrics is available 48-96 hours after online publication and is updated daily on week days.
Initial download of the metrics may take a while.


