Open Access
Fig. 8.
Download original image
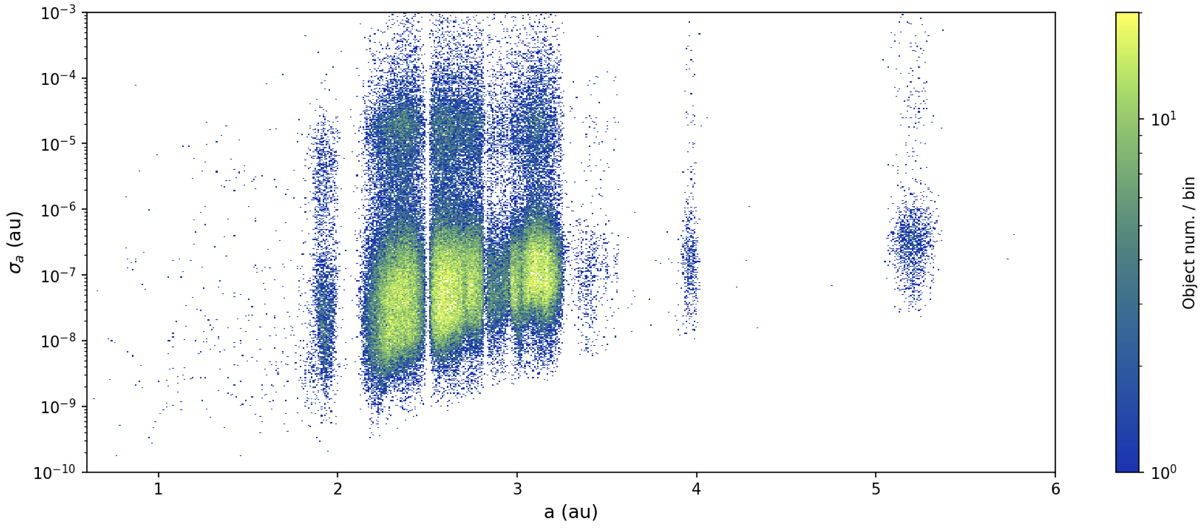
Computed uncertainty of the semi-major axis σa for the orbits published with Gaia DR3 as a function of the semi-major axis itself. Colour represents the density of objects computed in the bins (600 × 500 bins in the axis range).
Current usage metrics show cumulative count of Article Views (full-text article views including HTML views, PDF and ePub downloads, according to the available data) and Abstracts Views on Vision4Press platform.
Data correspond to usage on the plateform after 2015. The current usage metrics is available 48-96 hours after online publication and is updated daily on week days.
Initial download of the metrics may take a while.