Fig. 7.
Download original image
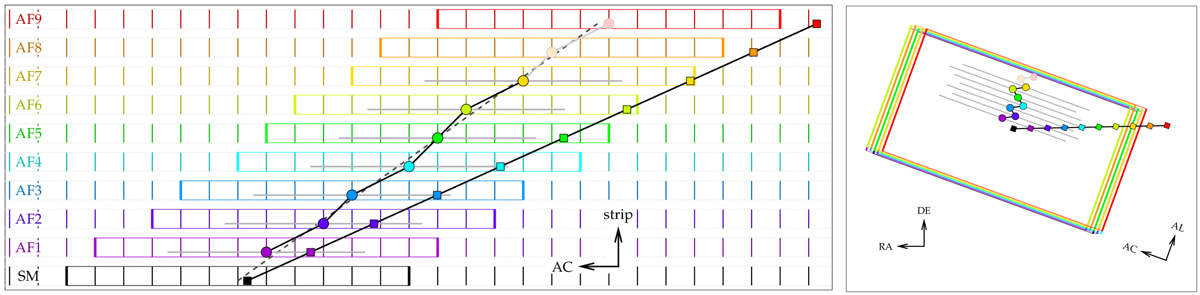
General illustration of the motion of an asteroid on the focal plane (left panel) and how this is translated into a position by the on-board windowing strategy. The horizontal axis represents the AC direction, and the vertical coloured bars are the pixels in the AC direction. The vertical axis represents the different CCD strips (their separation is conventional in this scheme). The coloured squares connected on the black line represent the real positions of the asteroid in the different CCD strips of the SM and AF instrument. The rectangular coloured boxes encompassing 12 AC pixels represent the assigned windows. The dashed black line represents the motion that a hypothetical star would have, starting from the same position as the asteroid in SM. The assignment of the windows in AF is such that their AC positions, corresponding to their centres (coloured circles), closely follow the dashed line. This AC position is transmitted to the ground. The horizontal light grey lines represent the uncertainties on the positions in AC, which correspond to the dispersion of a rectangular distribution over the assigned window. The right panel shows how this translates into positions on the sky plane.
Current usage metrics show cumulative count of Article Views (full-text article views including HTML views, PDF and ePub downloads, according to the available data) and Abstracts Views on Vision4Press platform.
Data correspond to usage on the plateform after 2015. The current usage metrics is available 48-96 hours after online publication and is updated daily on week days.
Initial download of the metrics may take a while.