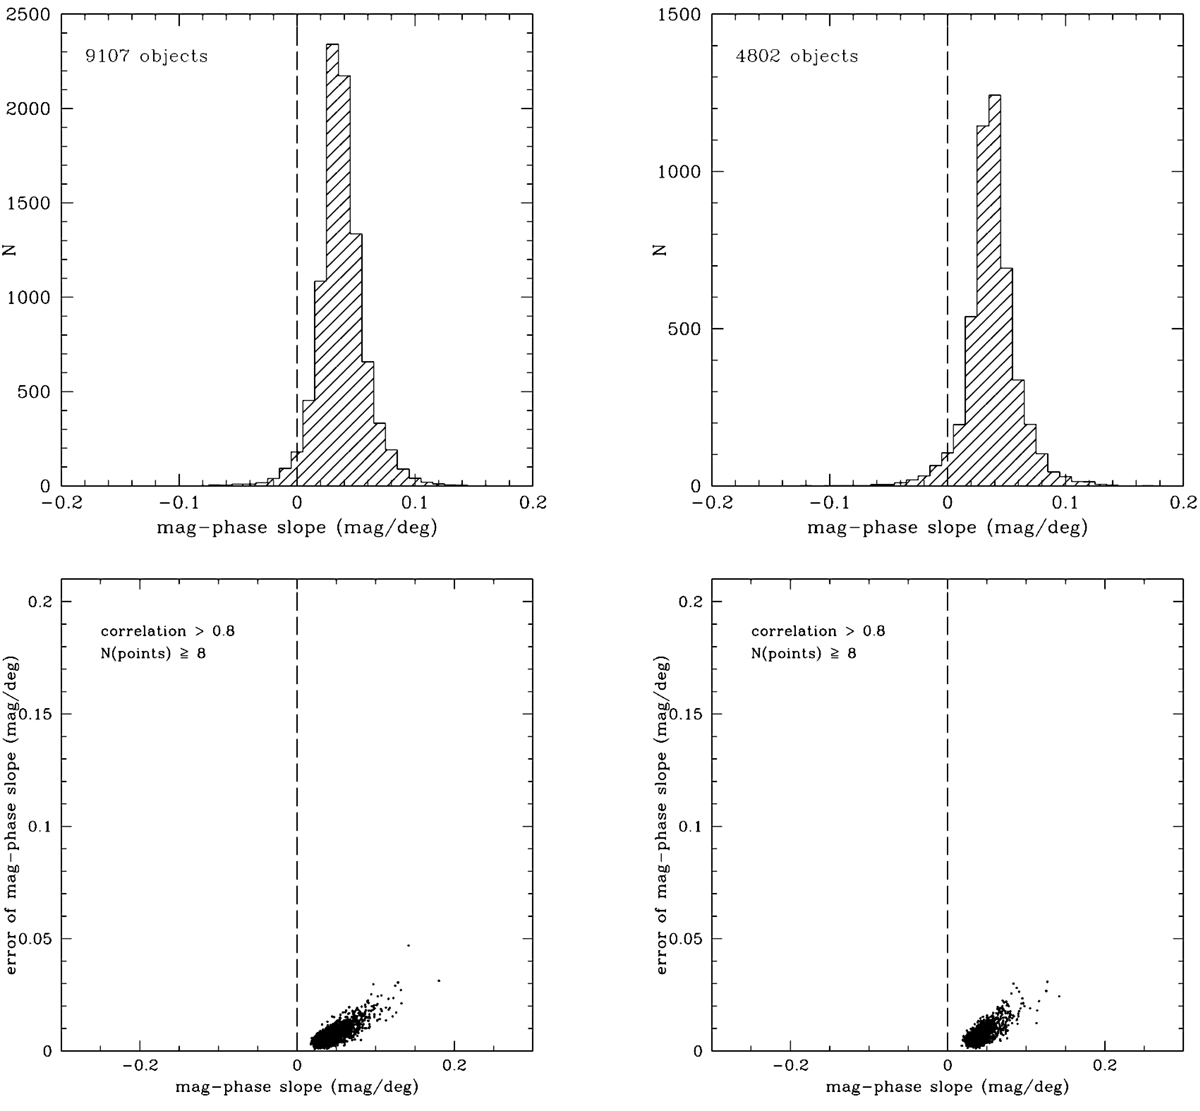
Fig. 23.
Download original image
Histogram of the computed slopes of the linear fits of the phase – magnitude for asteroids numbered from 1 to 10 000 (top right). The top right panel shows the same, but for objects numbered from 100 000 to 110 000. The bottom left panel shows the slope error vs. slope for asteroids numbered from 1 to 10 000 after those with values of the resulting linear correlation < 0.8 and/or a number of accepted transits < 8 were removed. The bottom right panel shows the same, but for asteroids numbered from 100 000 to 110 000.
Current usage metrics show cumulative count of Article Views (full-text article views including HTML views, PDF and ePub downloads, according to the available data) and Abstracts Views on Vision4Press platform.
Data correspond to usage on the plateform after 2015. The current usage metrics is available 48-96 hours after online publication and is updated daily on week days.
Initial download of the metrics may take a while.