Fig. 2.
Download original image
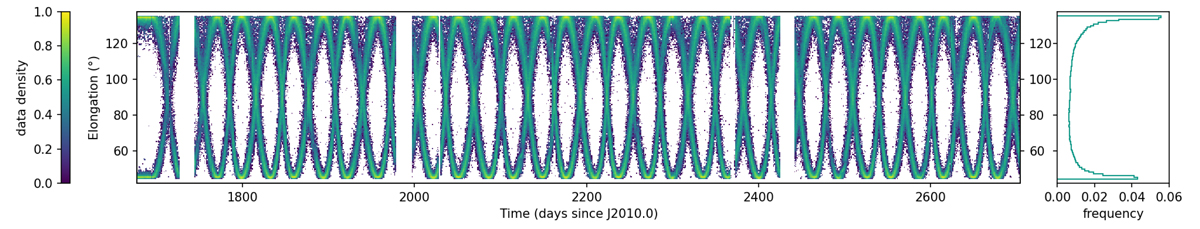
Distribution of the observations of Solar System objects in solar elongation as a function of time. Colour is related to data density. Two overlapping sinusoids appear, corresponding to the variation in the directions in which the scanning plane of Gaia intersects the ecliptic due to the precession of the spin axis of the satellite. The peaks correspond to periods in which the ecliptic is crossed by the scan both at ∼45° and in the opposite direction ∼135°. In these conditions, the scanning plane is perpendicular to the ecliptic. Scattered data correspond to detections of objects at high ecliptic inclination. The nodes of the sinusoids are around quadrature (90° elongation), when the scanning plane cuts the ecliptic at 45°. An initial period without precession (enforcing the ecliptic pole scanning law) is visible. Three gaps appear, corresponding to technical operations preventing the normal collection of data. In the right panel, the cumulative distribution shows the preferential accumulation of observations at the extremes.
Current usage metrics show cumulative count of Article Views (full-text article views including HTML views, PDF and ePub downloads, according to the available data) and Abstracts Views on Vision4Press platform.
Data correspond to usage on the plateform after 2015. The current usage metrics is available 48-96 hours after online publication and is updated daily on week days.
Initial download of the metrics may take a while.