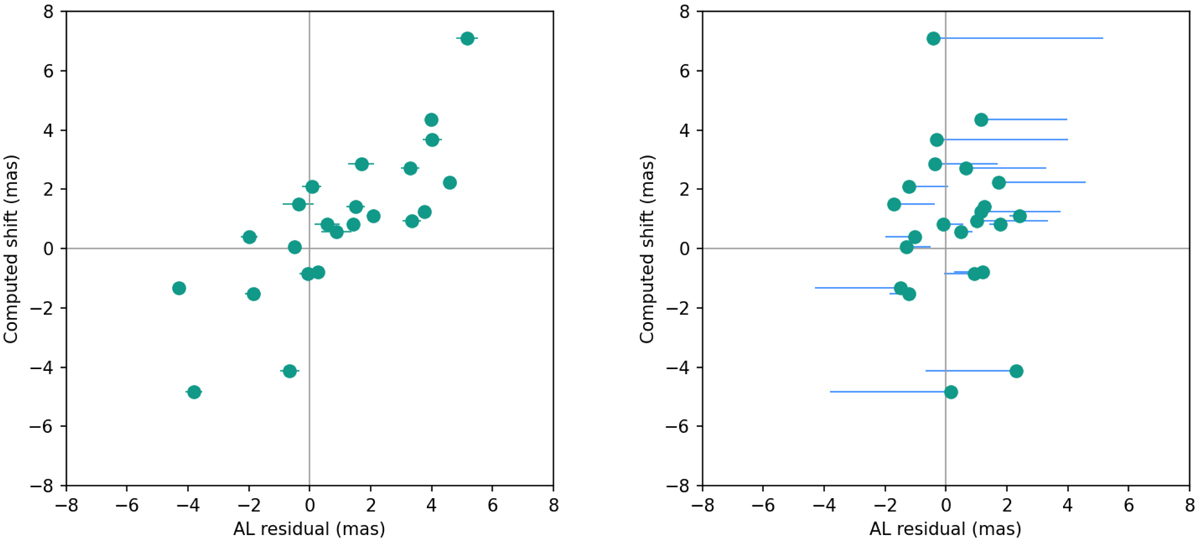
Fig. 18.
Download original image
Comparison between the average transit residuals for (21) Lutetia in the AL direction (x-axis) and the computed photocentre shift from the light scattering model (y-axis; left). The error bars represent the standard deviation of the residual across the transit (often smaller than the symbol size). The right panel shows the equivalent plot after correcting for the for the computed shift. The lines represent the displacement of each data point with respect to the left panel.
Current usage metrics show cumulative count of Article Views (full-text article views including HTML views, PDF and ePub downloads, according to the available data) and Abstracts Views on Vision4Press platform.
Data correspond to usage on the plateform after 2015. The current usage metrics is available 48-96 hours after online publication and is updated daily on week days.
Initial download of the metrics may take a while.