Fig. 15.
Download original image
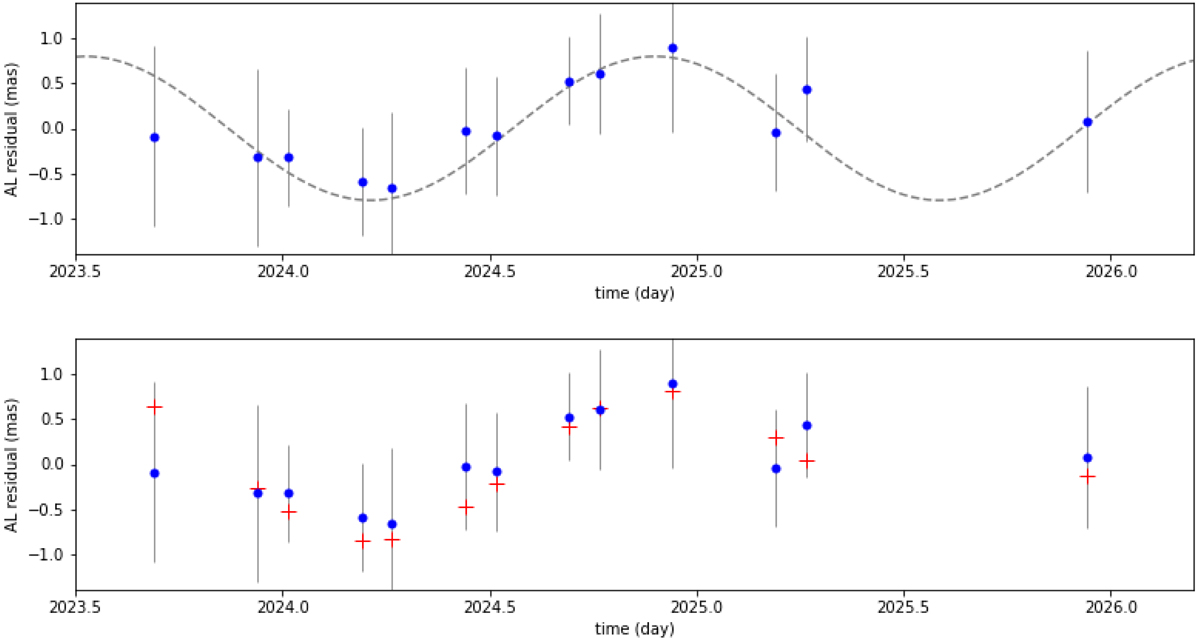
Residuals to the orbital fit of (4337) Arecibo (blue dots). They are obtained from the average of single-observation residuals over each transit. The error bars are given by their standard deviation. In the top panel, the dashed grey line is not a model fit, but a simple overplotting of a sinusoid of the period derived by photometry, adjusted in amplitude (0.8 mas) and phase to the data. In the bottom panel, the same data are shown with the residuals predicted by the optimised binary model described in the text (red crosses).
Current usage metrics show cumulative count of Article Views (full-text article views including HTML views, PDF and ePub downloads, according to the available data) and Abstracts Views on Vision4Press platform.
Data correspond to usage on the plateform after 2015. The current usage metrics is available 48-96 hours after online publication and is updated daily on week days.
Initial download of the metrics may take a while.