Open Access
Fig. 12.
Download original image
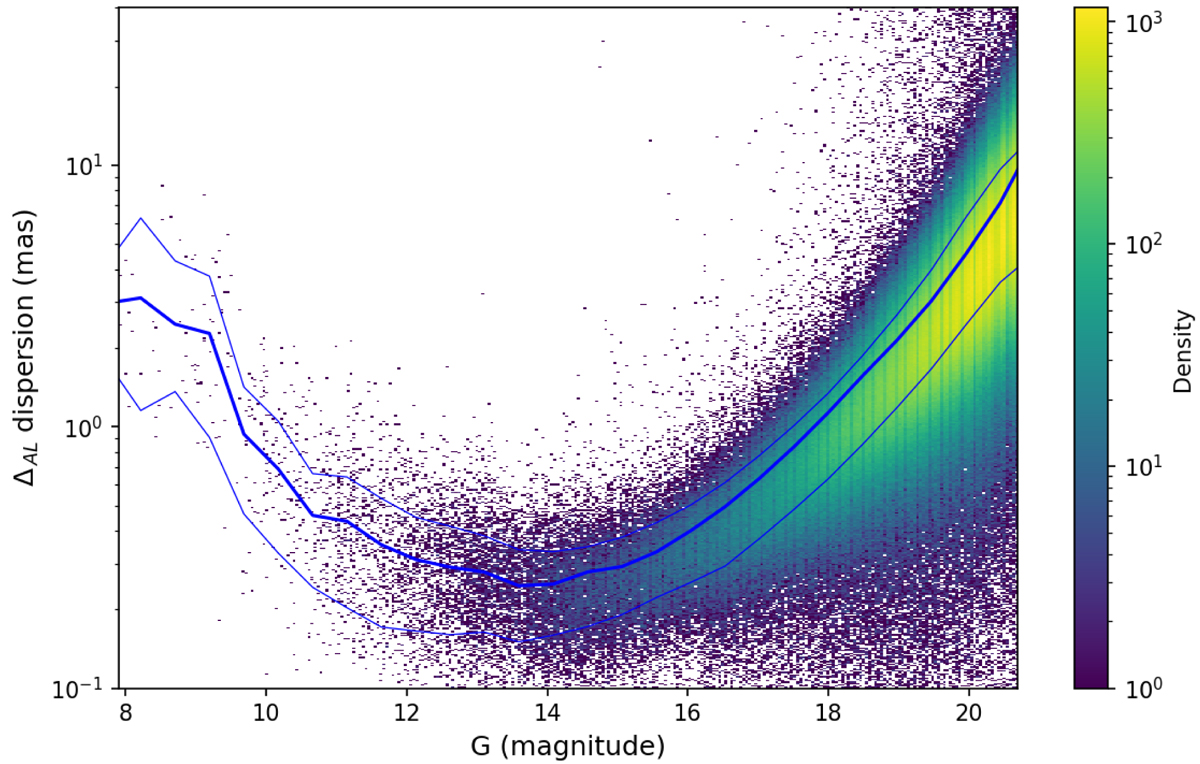
Dispersion of post-fit residuals in AL for each transit. The colour represents the data density. The deep blue line shows the mean, and the light blue lines show the quantiles corresponding to 1-sigma, computed over 50 bins in the interval of G magnitude from 8 to 21 mag.
Current usage metrics show cumulative count of Article Views (full-text article views including HTML views, PDF and ePub downloads, according to the available data) and Abstracts Views on Vision4Press platform.
Data correspond to usage on the plateform after 2015. The current usage metrics is available 48-96 hours after online publication and is updated daily on week days.
Initial download of the metrics may take a while.