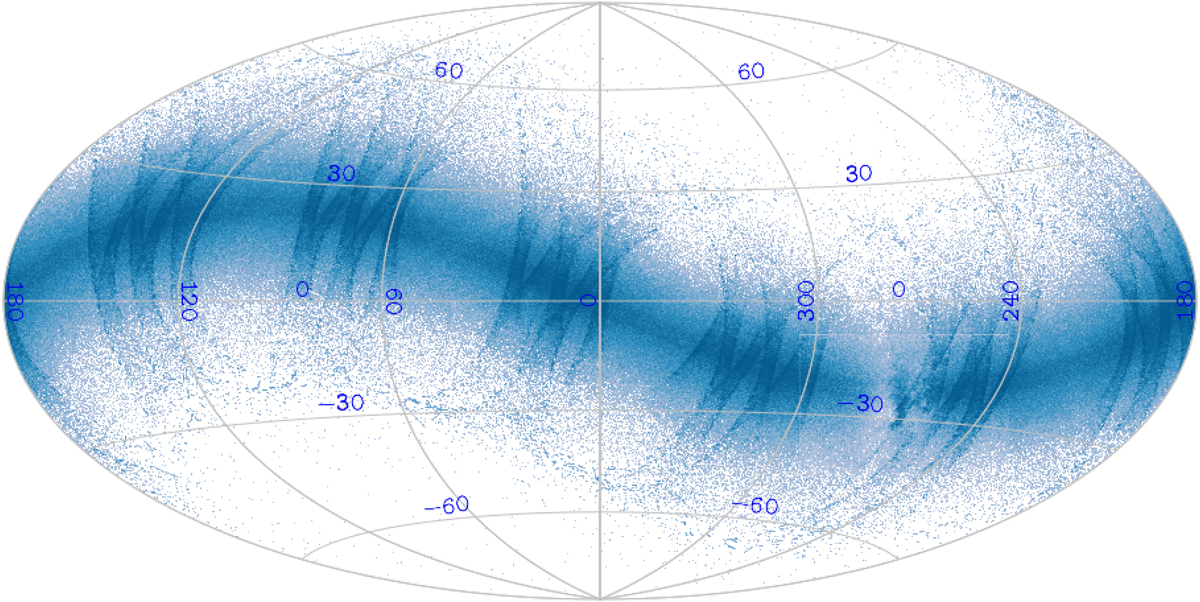
Fig. 1.
Download original image
Positions of the transits of sources published in Gaia DR3 in a full-sky Hammer-Aitoff projection in equatorial coordinates. The origin of RA and Dec is at the centre, north is up, and α increases from right to left. Darkness is related to the density of observations. Some density patterns related to the Gaia scanning law are clearly present. It is interesting to note the emergence of the highest stellar density regions as less dark areas close to the Galactic centre (around RA = 270° and Dec = −30°), where the efficiency of unambiguous identifications decreases.
Current usage metrics show cumulative count of Article Views (full-text article views including HTML views, PDF and ePub downloads, according to the available data) and Abstracts Views on Vision4Press platform.
Data correspond to usage on the plateform after 2015. The current usage metrics is available 48-96 hours after online publication and is updated daily on week days.
Initial download of the metrics may take a while.