Fig. 44.
Download original image
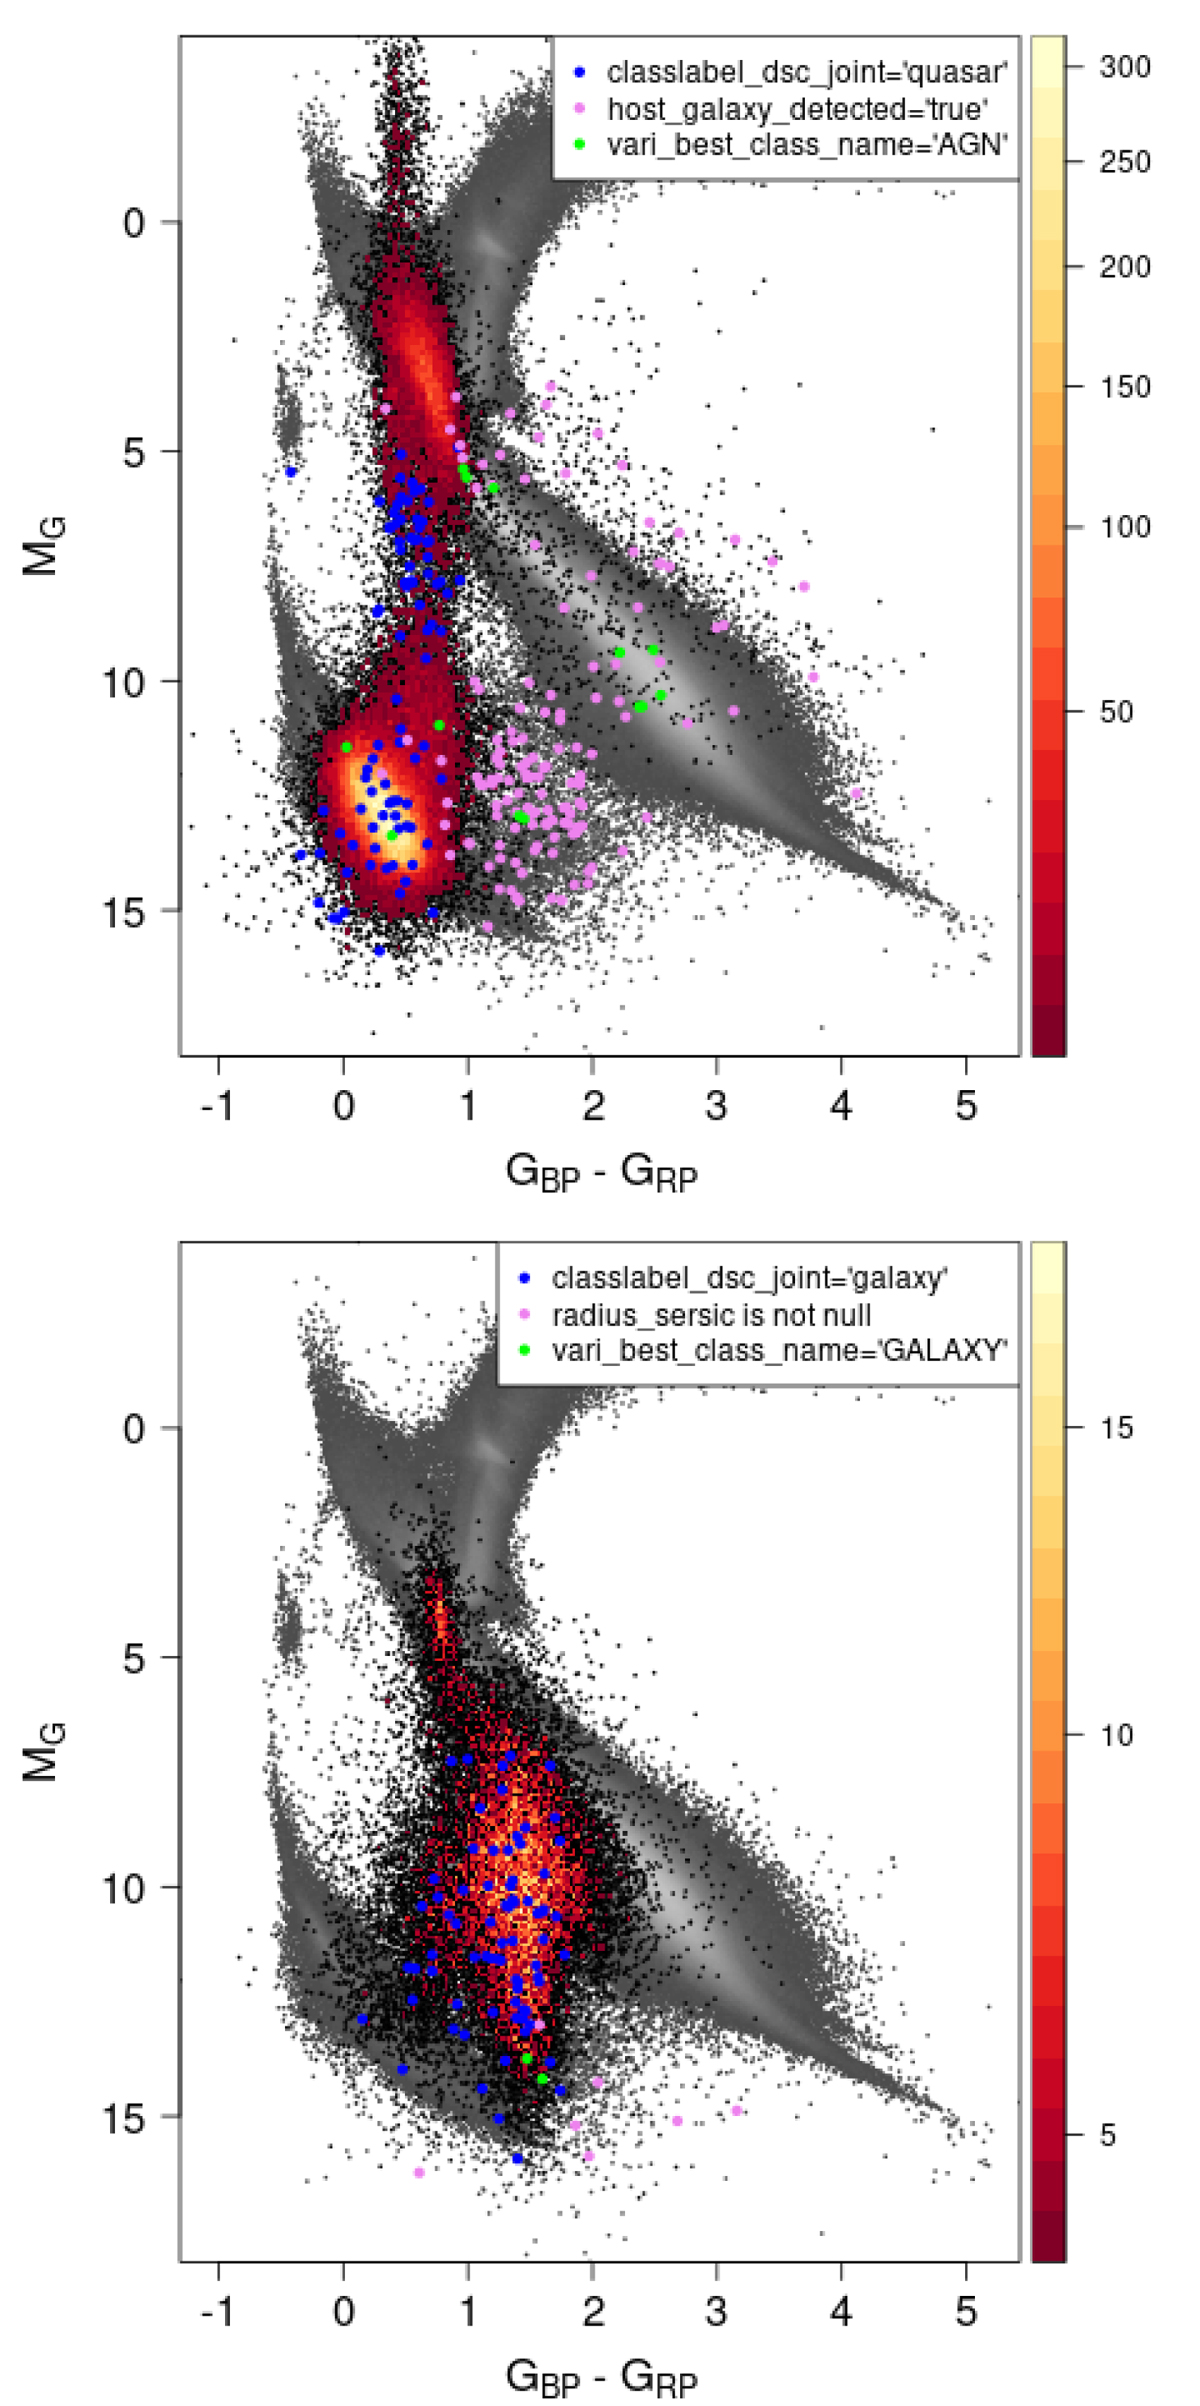
Gaia DR3 low-extinction HR diagram (grey scale). The position of sources in the QSO (top) and galaxy (bottom) candidate tables with parallax_over_error > 5 is overplotted with a red scaling with the square root of the number of sources. Colour points correspond to the stricter selection of candidates proposed in Gaia Collaboration (2023b).
Current usage metrics show cumulative count of Article Views (full-text article views including HTML views, PDF and ePub downloads, according to the available data) and Abstracts Views on Vision4Press platform.
Data correspond to usage on the plateform after 2015. The current usage metrics is available 48-96 hours after online publication and is updated daily on week days.
Initial download of the metrics may take a while.