Open Access
Fig. 42.
Download original image
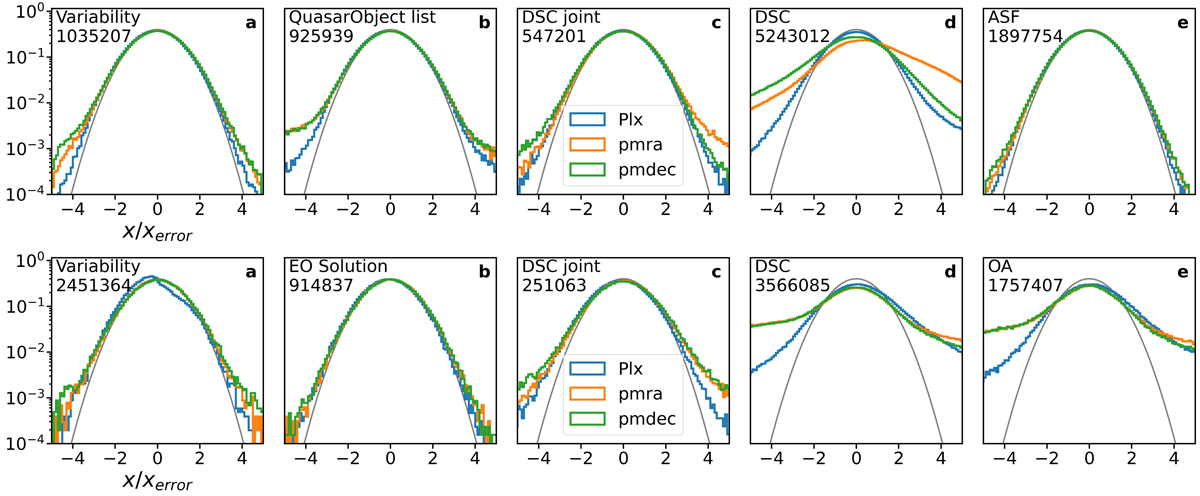
Astrometric properties of the different subsamples contained within the QSO (top) and galaxy (bottom) candidate tables. Each panel contains the distribution of parallaxes and proper motions, normalised to their errors. The grey line corresponds to a normal distribution.
Current usage metrics show cumulative count of Article Views (full-text article views including HTML views, PDF and ePub downloads, according to the available data) and Abstracts Views on Vision4Press platform.
Data correspond to usage on the plateform after 2015. The current usage metrics is available 48-96 hours after online publication and is updated daily on week days.
Initial download of the metrics may take a while.