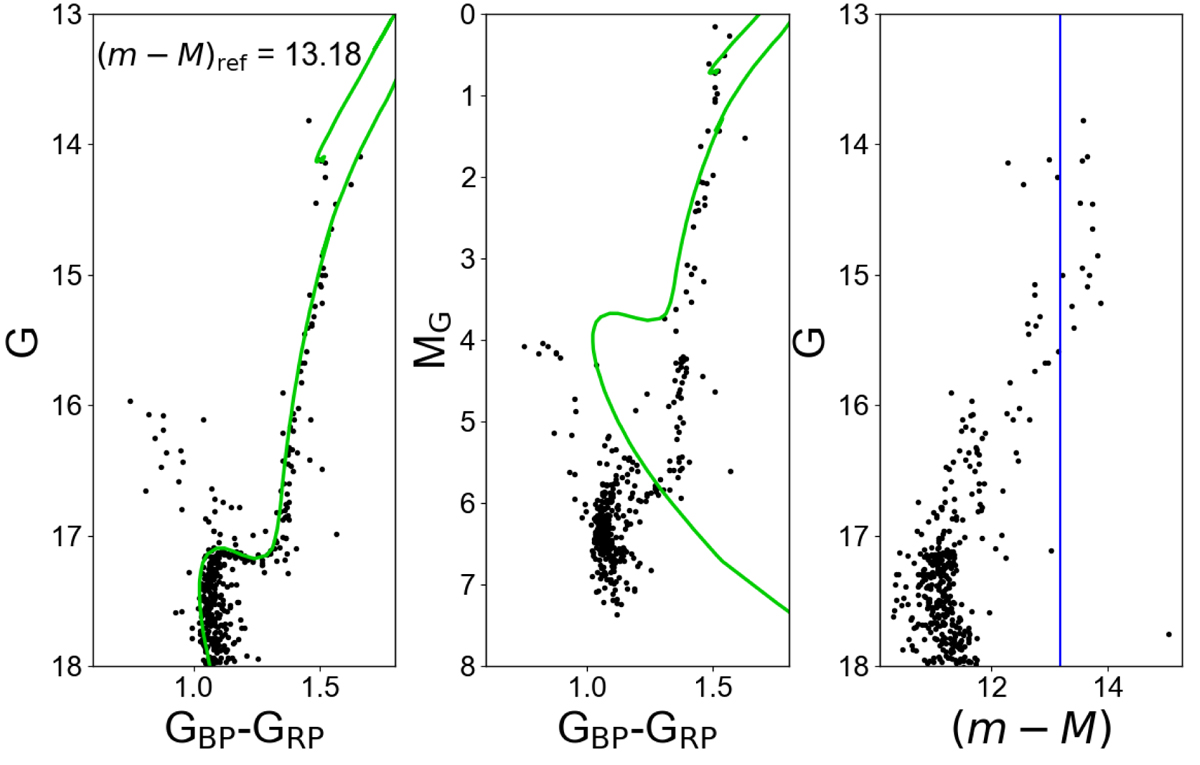
Fig. 39.
Download original image
Colour-magnitude diagram of NGC 6791 (left panel), mg_gspphot vs. GBP − GRP (central panel), and G vs. distance modulus (m − M) derived from distance_gspphot (right panel). The blue line in the right panel shows the literature value, and the green lines in the left and central panels show the PARSEC isochrone, which has the same parameters as the cluster.
Current usage metrics show cumulative count of Article Views (full-text article views including HTML views, PDF and ePub downloads, according to the available data) and Abstracts Views on Vision4Press platform.
Data correspond to usage on the plateform after 2015. The current usage metrics is available 48-96 hours after online publication and is updated daily on week days.
Initial download of the metrics may take a while.