Open Access
Fig. 34.
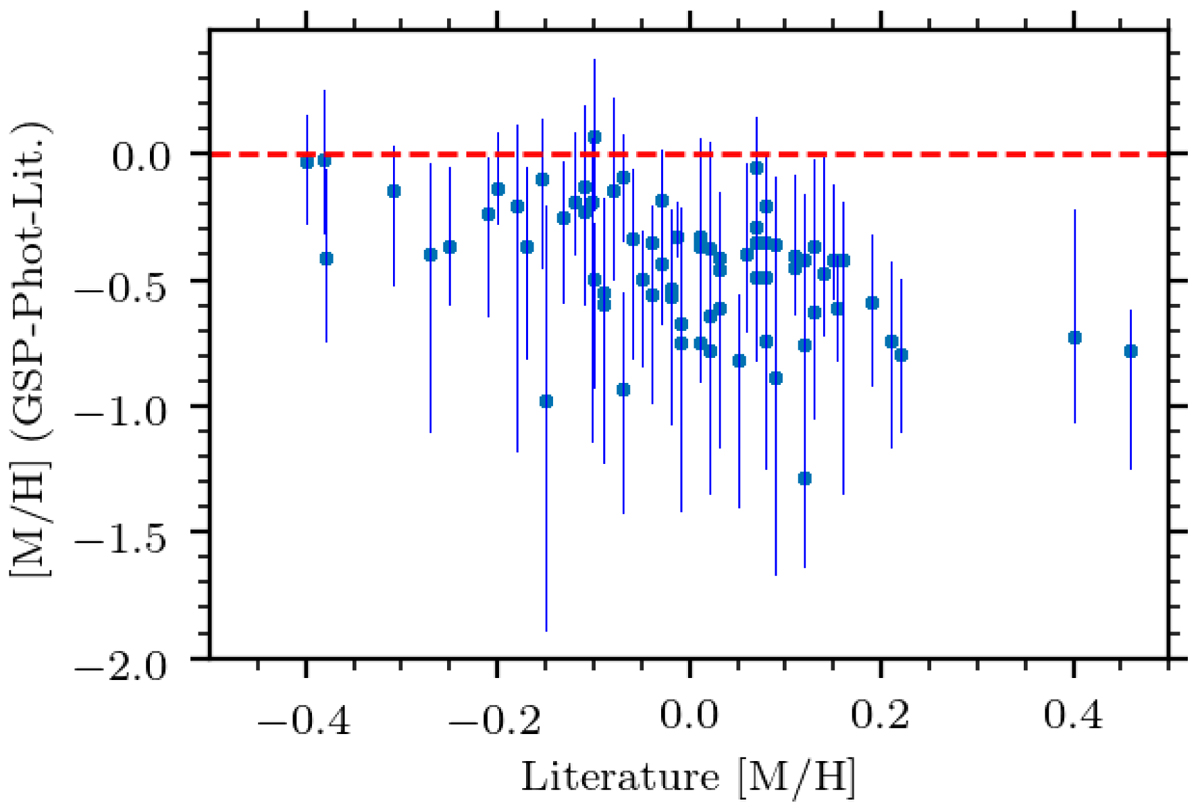
Download original image
Comparison of mh_gspphot with literature values from open clusters. We plot the median value for each cluster. The error bars show the dispersion around the median. The red line indicates the zero value.
Current usage metrics show cumulative count of Article Views (full-text article views including HTML views, PDF and ePub downloads, according to the available data) and Abstracts Views on Vision4Press platform.
Data correspond to usage on the plateform after 2015. The current usage metrics is available 48-96 hours after online publication and is updated daily on week days.
Initial download of the metrics may take a while.