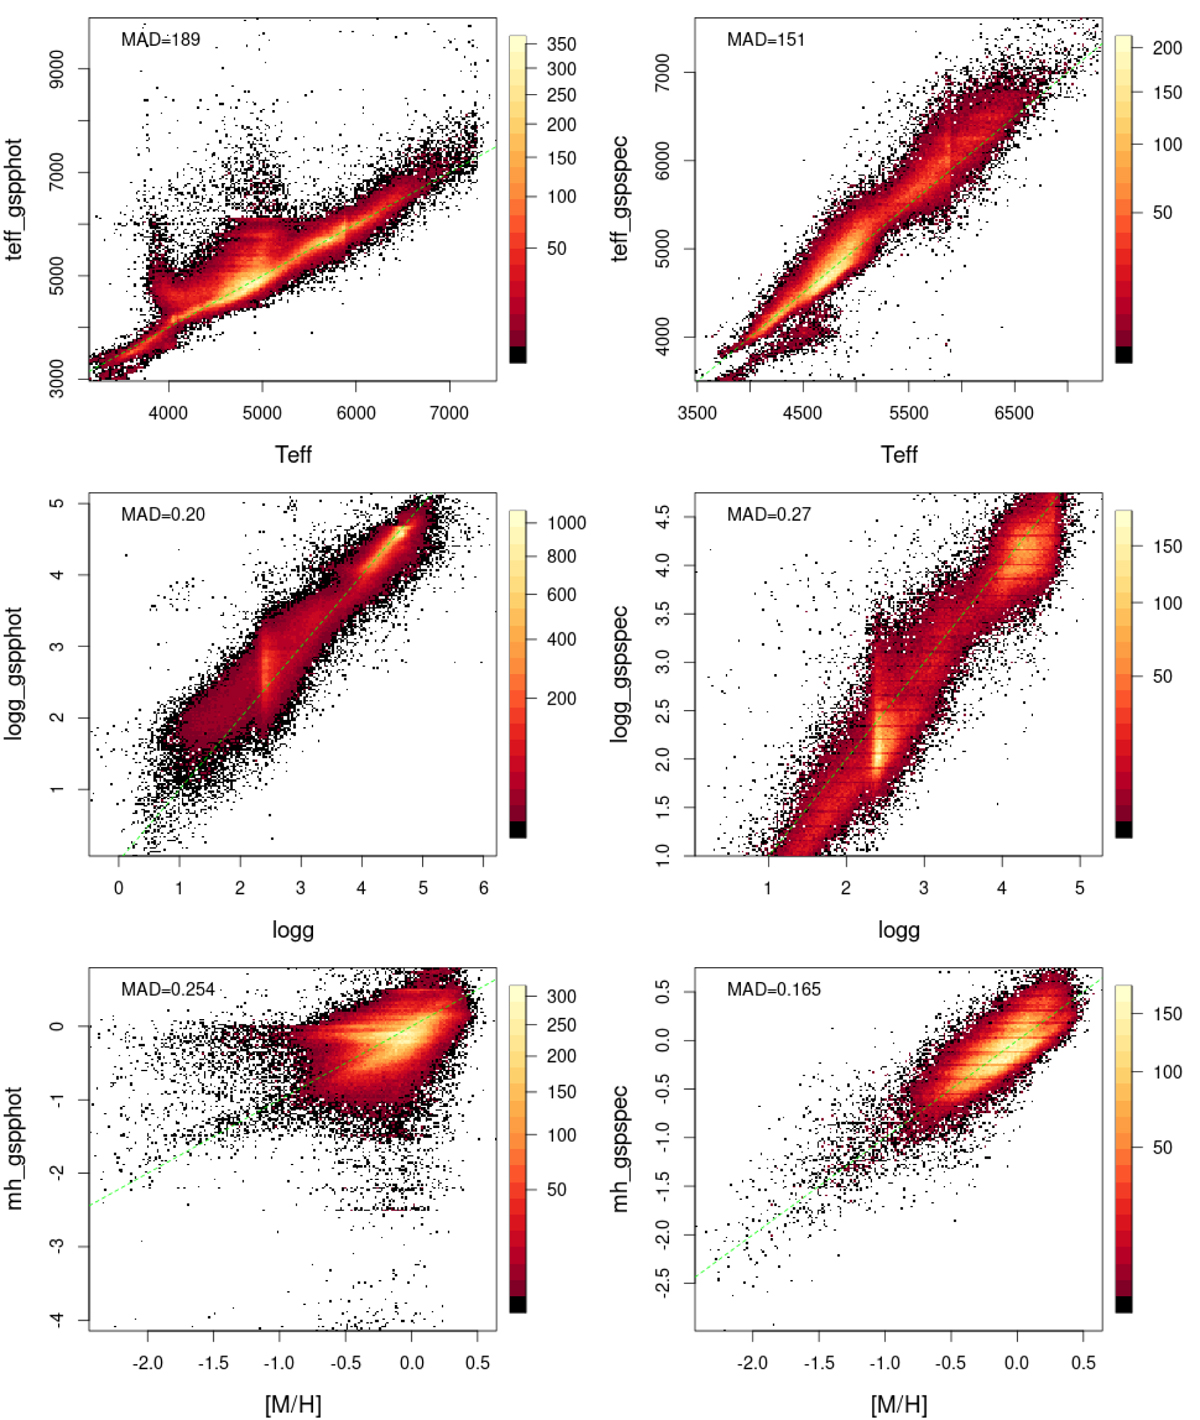
Fig. 33.
Download original image
Density plot of the comparison of the temperature (top), surface gravity (middle), and global metallicity (bottom) provided by GSP-Phot (left) and GSP-Spec (right) with APOGEE DR16. GSP-Phot has been filtered with parallax_over_error > 10, and teff_gspphot < 10 000. GSP-Spec parameters have been filtered with flags_gspspec[1,4,8,13] = 0 for Teff, flags_gspspec[2,5,8,13] = 0 for log g, and flags_gspspec[3,6,8] = 0 for [M/H]. The RVS spectrum signal-to-noise ratio was not filtered.
Current usage metrics show cumulative count of Article Views (full-text article views including HTML views, PDF and ePub downloads, according to the available data) and Abstracts Views on Vision4Press platform.
Data correspond to usage on the plateform after 2015. The current usage metrics is available 48-96 hours after online publication and is updated daily on week days.
Initial download of the metrics may take a while.