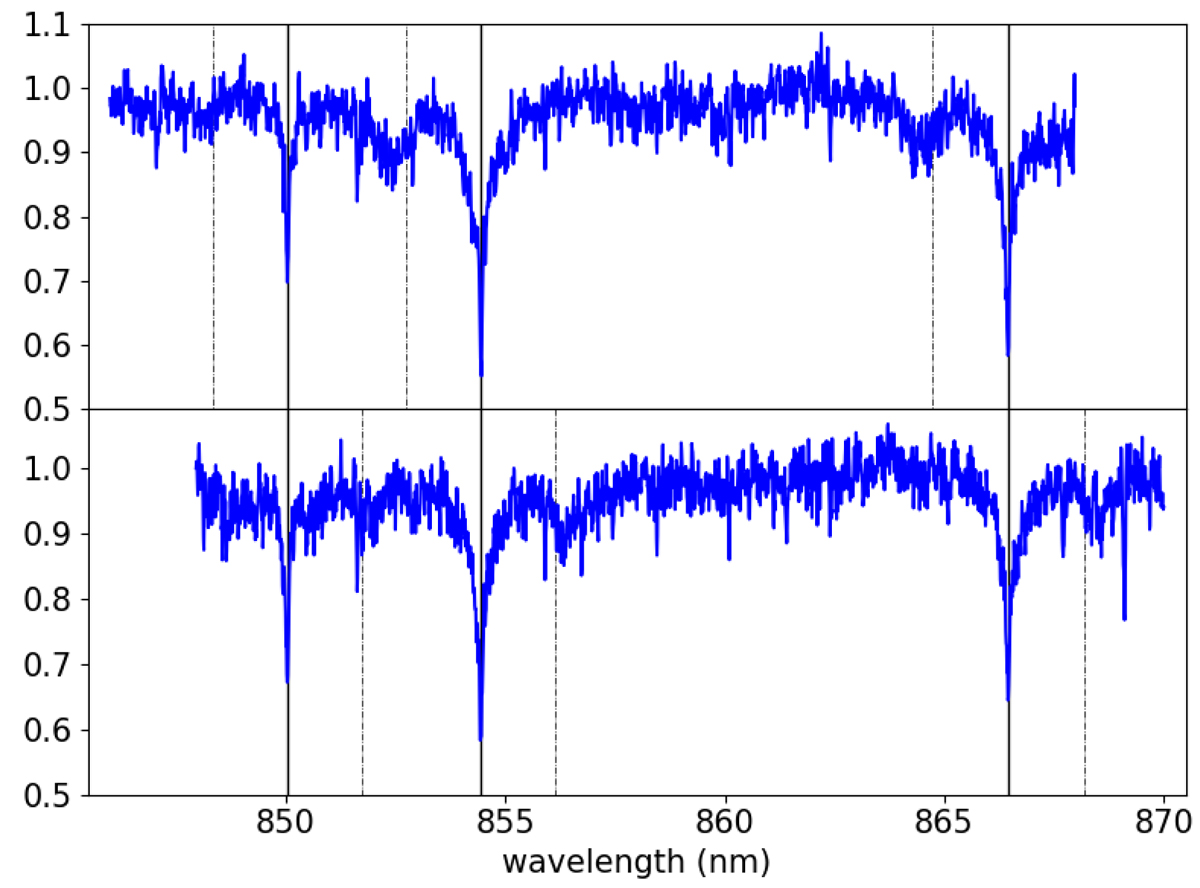
Fig. 3.
Download original image
Stacked spectra for all the sources with a radial velocity > 600 km s−1 (421 sources, top) and <−600 km s−1 (349 sources, bottom). Solid vertical lines indicate the position of the calcium triplet, and dashed lines show the same lines shifted by 1.7 nm, indicating where the spectral line would be if the radial velocity correction were incorrect by 600 km s−1.
Current usage metrics show cumulative count of Article Views (full-text article views including HTML views, PDF and ePub downloads, according to the available data) and Abstracts Views on Vision4Press platform.
Data correspond to usage on the plateform after 2015. The current usage metrics is available 48-96 hours after online publication and is updated daily on week days.
Initial download of the metrics may take a while.