Open Access
Fig. 29.
Download original image
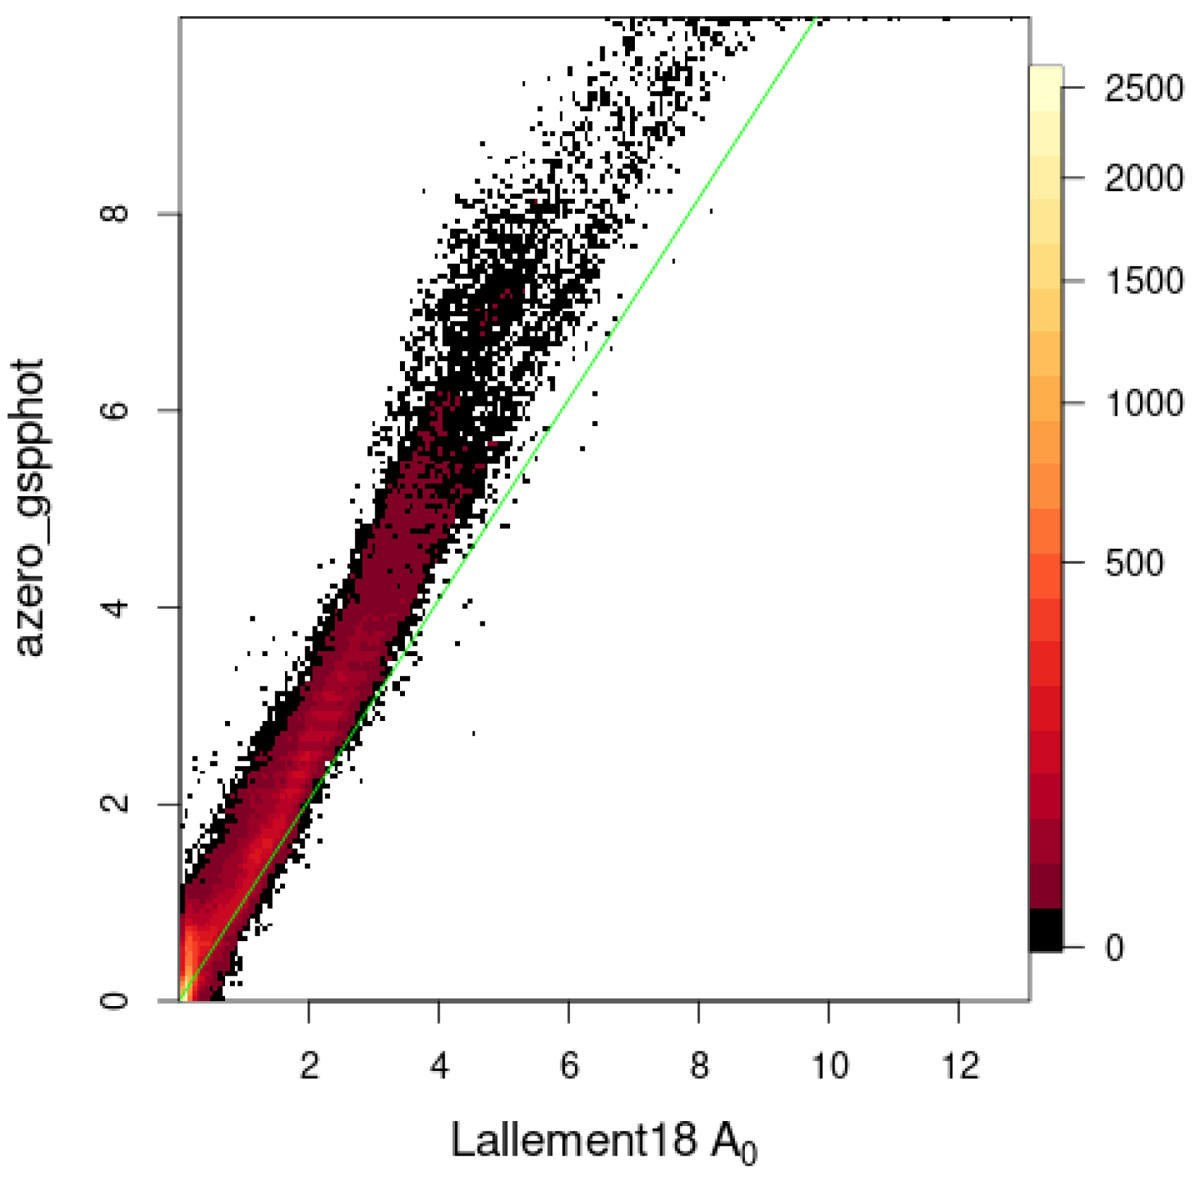
Density plot of the comparison of the monochromatic extinctions of GSP-Phot with those derived by Lallement et al. (2018). The green line corresponds to the 1.02 relation that is expected given the slight wavelength difference between the two A0.
Current usage metrics show cumulative count of Article Views (full-text article views including HTML views, PDF and ePub downloads, according to the available data) and Abstracts Views on Vision4Press platform.
Data correspond to usage on the plateform after 2015. The current usage metrics is available 48-96 hours after online publication and is updated daily on week days.
Initial download of the metrics may take a while.