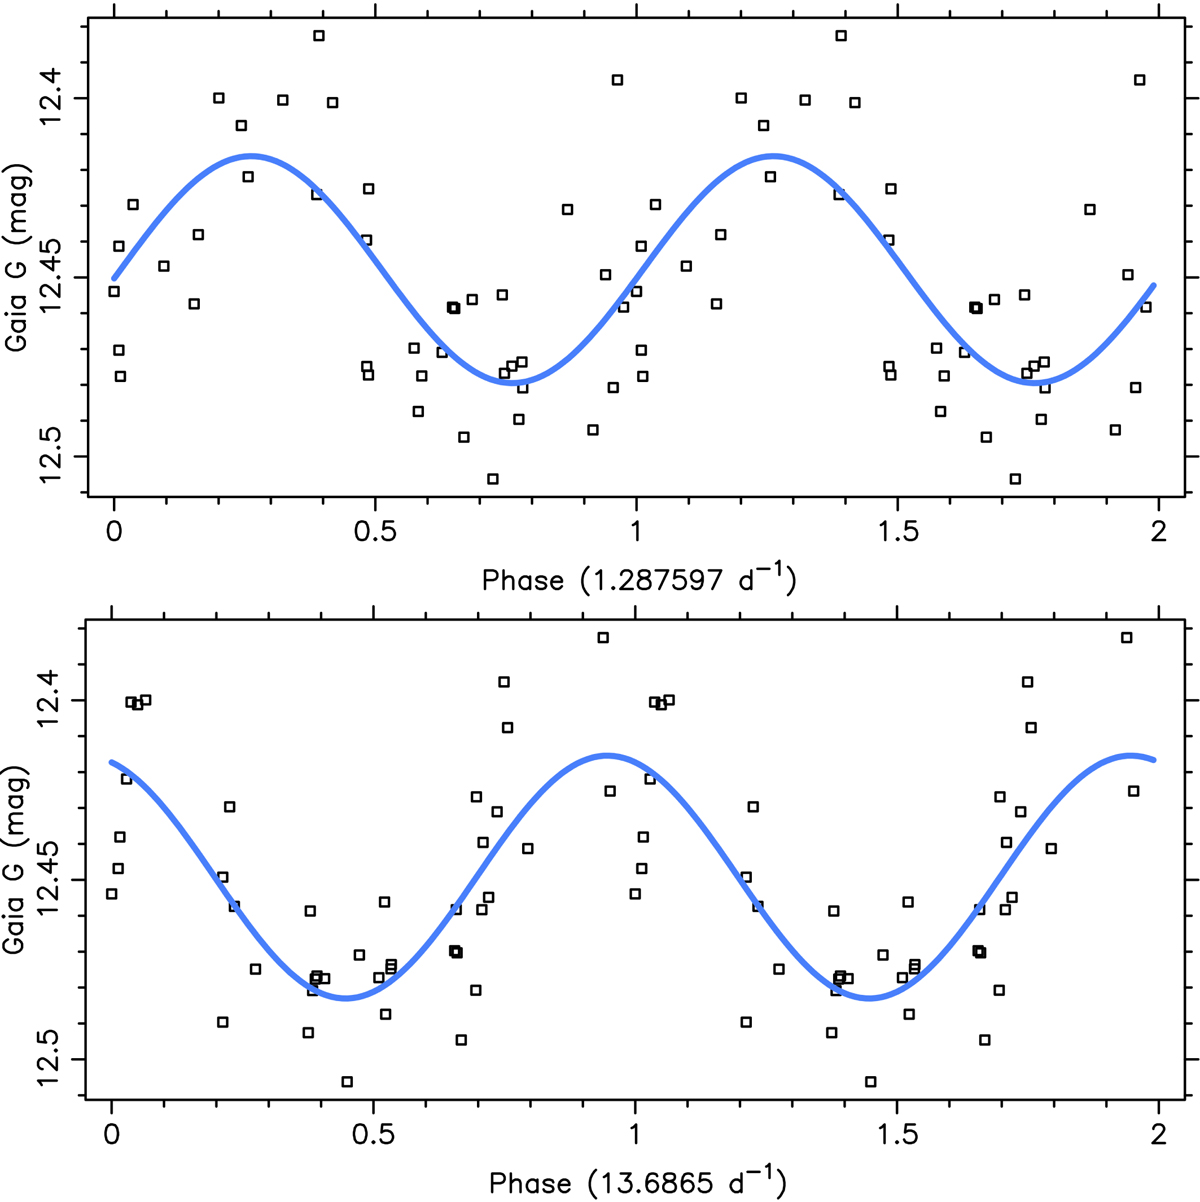
Fig. B.7.
Download original image
Two phase diagrams for the largest-amplitude g-mode pulsator in the γ Dor sample. The upper graph is phase-folded with the true dominant g-mode frequency derived from Kepler data; its fit leads to a variance reduction in the Gaia DR3 G-band data of 47%. The lower graph is phase-folded with the dominant frequency in the data, which is of instrumental origin and reduces the variance with 58%.
Current usage metrics show cumulative count of Article Views (full-text article views including HTML views, PDF and ePub downloads, according to the available data) and Abstracts Views on Vision4Press platform.
Data correspond to usage on the plateform after 2015. The current usage metrics is available 48-96 hours after online publication and is updated daily on week days.
Initial download of the metrics may take a while.